Date: Fri, 26 Nov 2021 21:16:21 +0500
Dear Amber users
I have performed two independent trajectory runs of a protein-ligand
complex for 100ns. To see the convergence I performed cluster analysis on
two trajectories each consisting of 10000 frames using k mean clustering
algorithm as shown in the tutorial
https://amberhub.chpc.utah.edu/clustering-a-protein-trajectory/
I got the files cnumvtime, cpovtime along with singlerep.nc by using the
following command line in cpptraj:-
parm complex_wild_nowat.prmtop
traj Dup1_combi_nowat.nc 1 last 10
trajin Dup1_combi_nowat.nc 1 last 10
trajin Heat7_nowat.nc 1 last 10
strip :Na+
cluster c1 kmeans clusters 10 randompoint maxit 500 rms :1-492.C,N,O,CA,CB&!.H=
sieve 10 random out cnumvtime.dat summary summary.dat info info.dat
cpopvtime cpopvtime.agr normframe repout rep repfmt pdb singlerepout
singlerep.nc singlerepfmt netcdf avgout avg avgfmt pdb
run
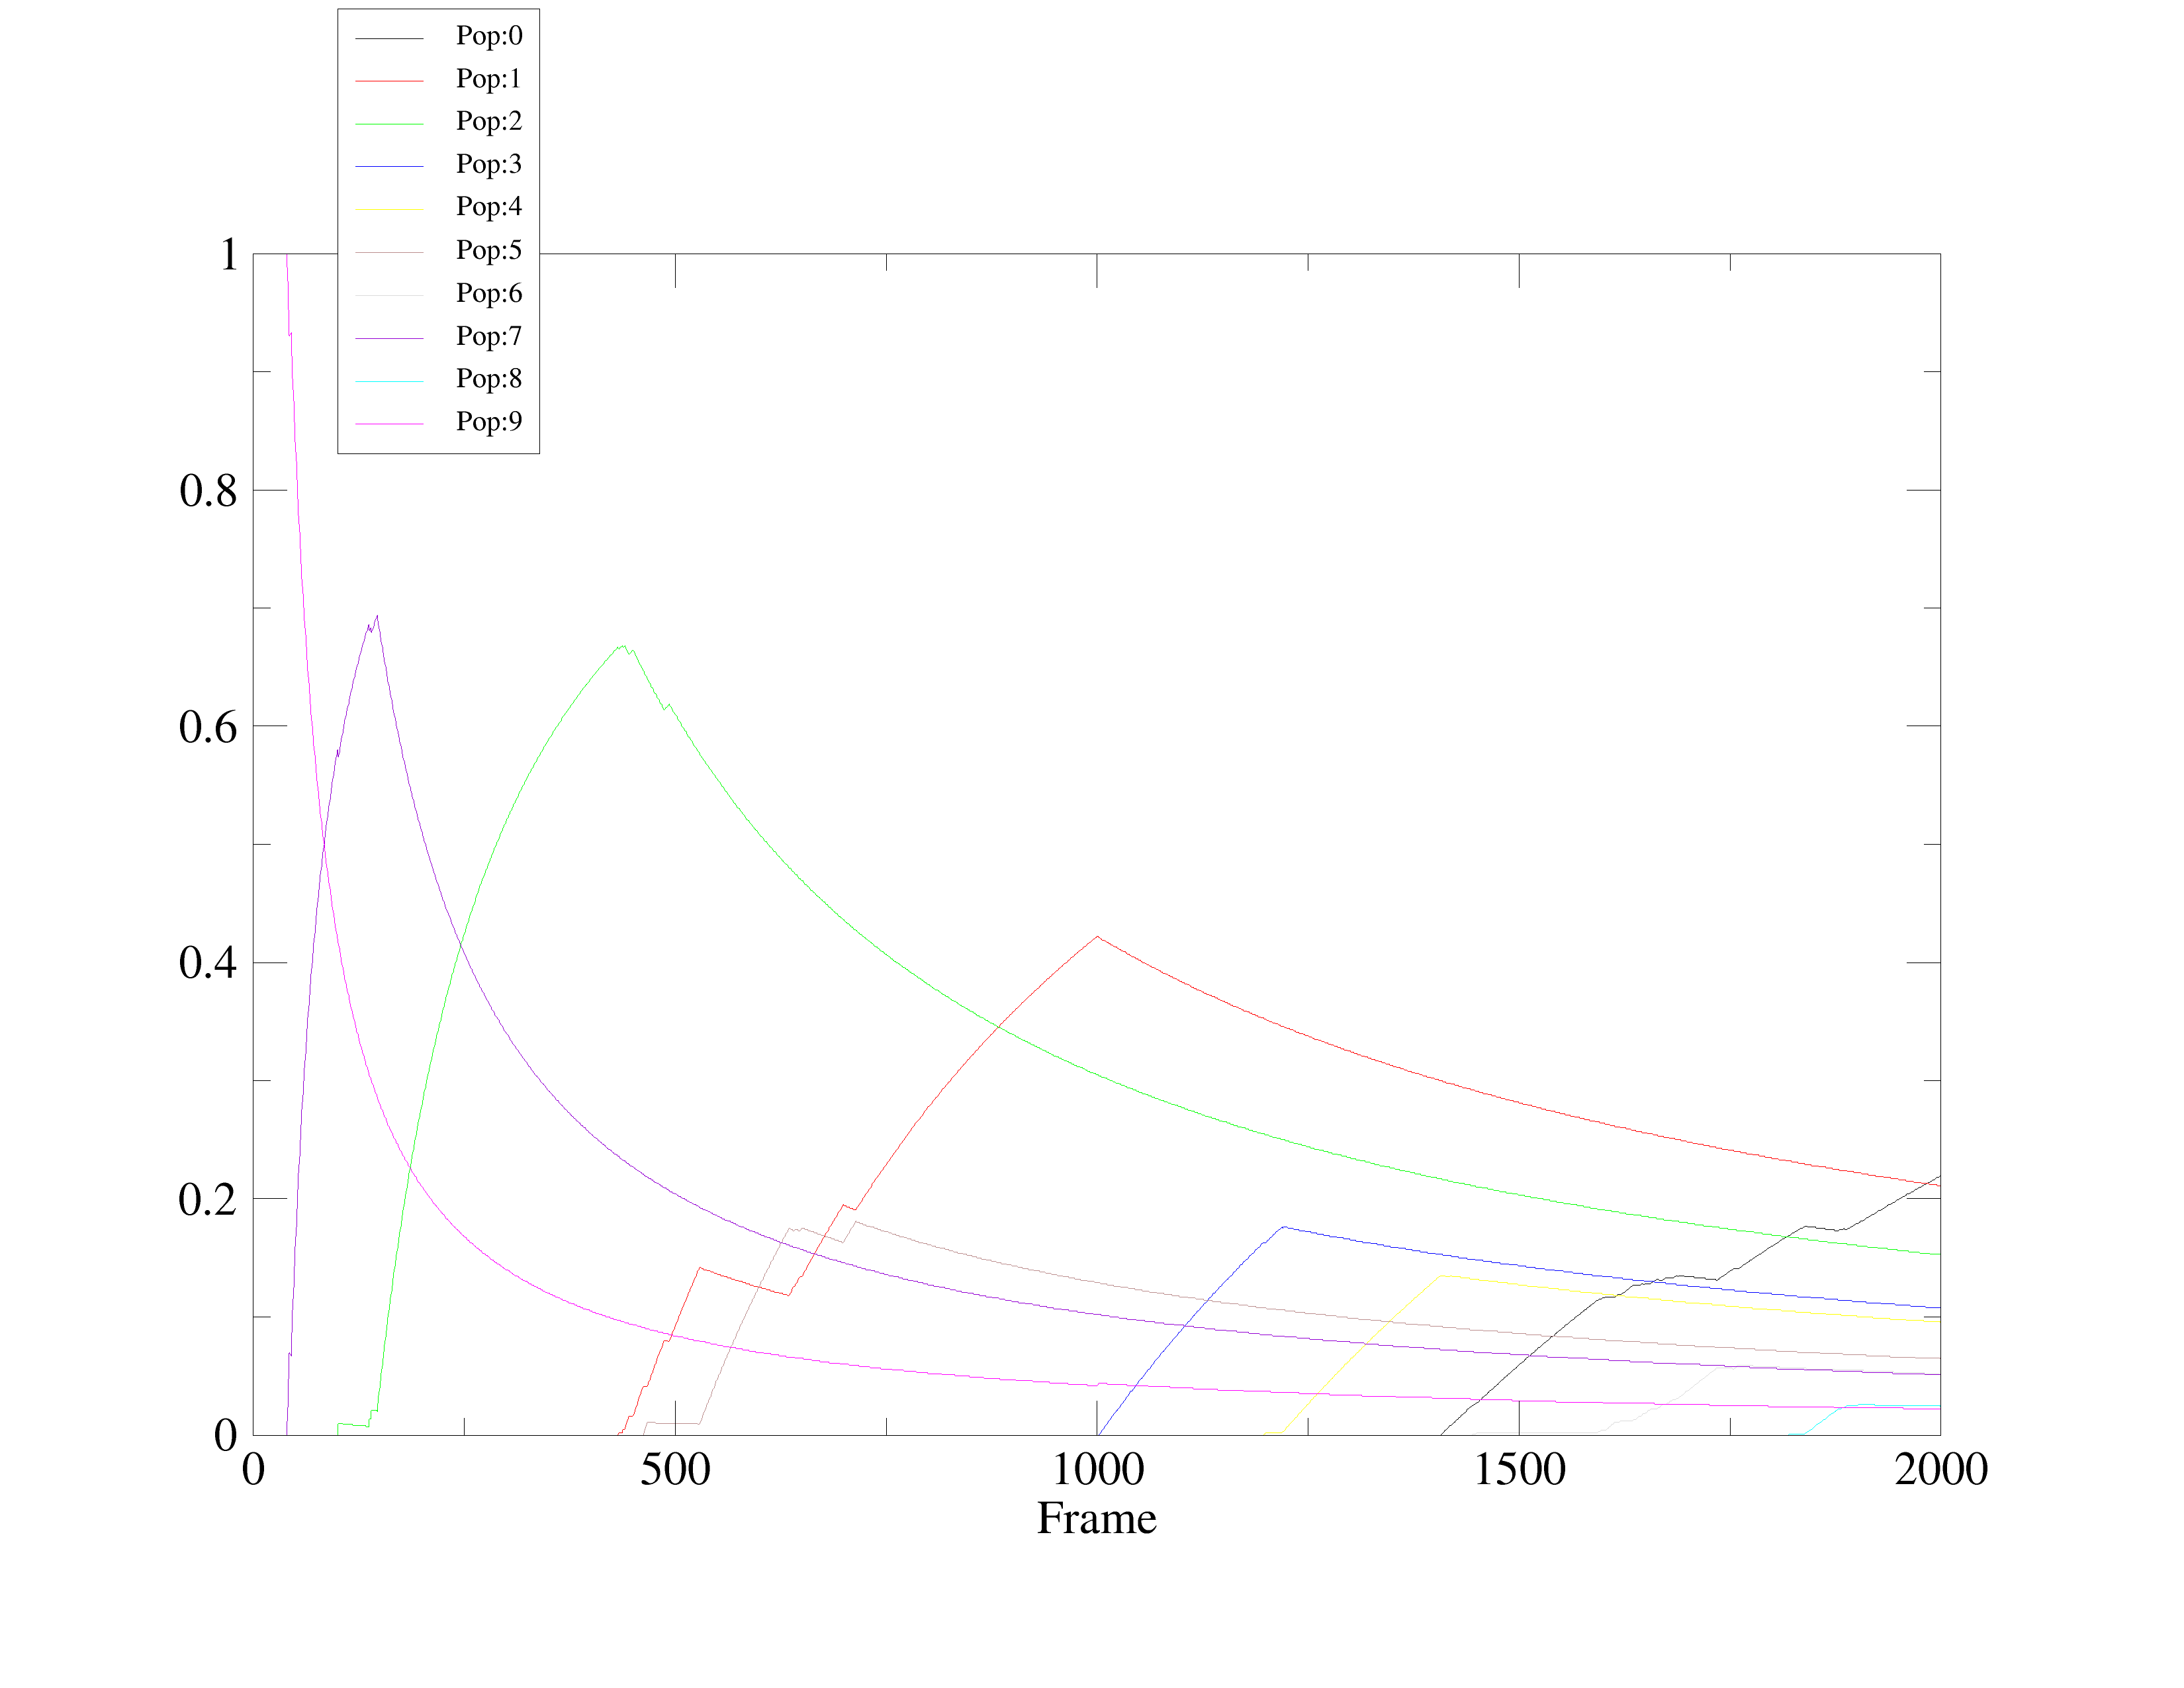
I am new to cluster analysis I am finding it difficult to interpret. I need
your kind suggestions to understand the results. From cpovtime I can see 10
clusters of the structure in which pop:9 should broader area under curve as
compared to Pop=0. Does it mean that the Pop=0 is the most centroid
cluster?
How can I use this information to analyze protein-ligand interaction?
Could you please help me to understand it?
Thanks in advance.
Regards
Sadaf
_______________________________________________
AMBER mailing list
AMBER.ambermd.org
http://lists.ambermd.org/mailman/listinfo/amber
(image/png attachment: cpopvtime.png)
- application/octet-stream attachment: cnumvtime.dat
