Date: Wed, 13 Mar 2019 17:54:12 +0100
Thank you for your reply,
what I meant was that I am getting plots (I attached figures) that look like sheets and I want plots like “rmsd”, “rmsf”, “rgyr”, the one entitled ‘secondary structure’. I want the evolution of secondary structure vs time represented like the second image
Myriam
From: Premila Samuel Mohan Dass
Sent: Wednesday, March 13, 2019 17:18
To: AMBER Mailing List
Subject: Re: [AMBER] DSSP residue vs time graph
Hi Miriam
You can try doing 3-dimensional surface plots across the 3 variables of secondary structure,time,residues. Look up Matlab’s surf command or Gnuplot’s 3D plots. I prefer 2D maps so I scaled my Matlab 3d-plot to a 2D using view(2) command which I assume is what gnuplot output is showing you too.
Premila
On Mar 13, 2019, at 11:30 AM, Myriam Hanna <myriamkhanna.gmail.com<mailto:myriamkhanna.gmail.com>> wrote:
Hello,
Is there a way to obtain a graph, a plot (not a ‘map’ the one that is generated by gnuplot) of secondary structure of residues vs time using cpptraj?
I can obtain .gnu .agr .xvg files but none of them show a plot that looks like rmsd or rmsf plots for dssp residues vs time
Thank you for your help
Myriam Hanna
_______________________________________________
AMBER mailing list
AMBER.ambermd.org<mailto:AMBER.ambermd.org>
https://nam02.safelinks.protection.outlook.com/?url=http%3A%2F%2Flists.ambermd.org%2Fmailman%2Flistinfo%2Famber&data=02%7C01%7Cps958%40iqb.rutgers.edu%7Cdf6f1b9e037c495dad9508d6a7c8f5f7%7Cb92d2b234d35447093ff69aca6632ffe%7C1%7C0%7C636880878895273020&sdata=5dso86RA9osgtyVFWTtlDuYdr7vp8GQvbTrNHIRj0hY%3D&reserved=0
_______________________________________________
AMBER mailing list
AMBER.ambermd.org
http://lists.ambermd.org/mailman/listinfo/amber
_______________________________________________
AMBER mailing list
AMBER.ambermd.org
http://lists.ambermd.org/mailman/listinfo/amber
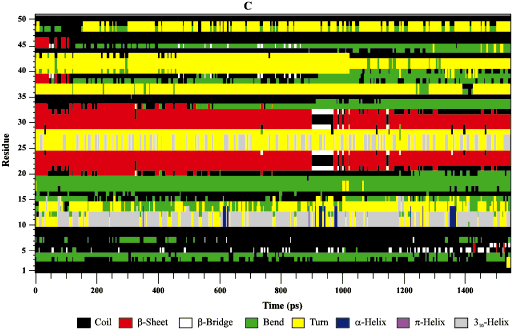
(image/png attachment: dssp_map.png)
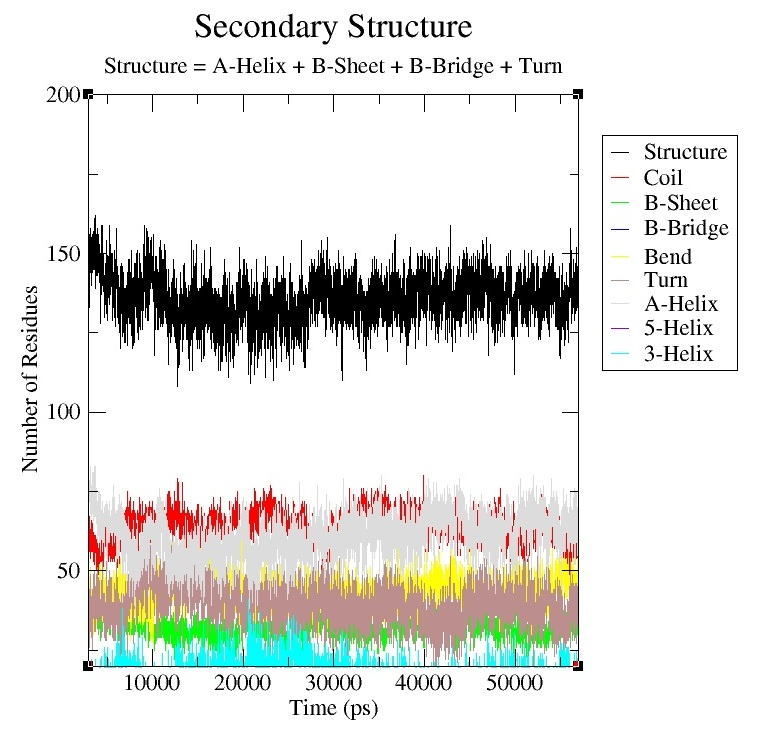
(image/png attachment: dssp_plots.png)
