Date: Fri, 17 Jun 2016 15:06:52 +0800
Sorry, the images do not attached correctly, I'm inserting them again.
Thank you
On Fri, Jun 17, 2016 at 3:02 PM, colvin <colvin4367.gmail.com> wrote:
>
> Hello all,
>
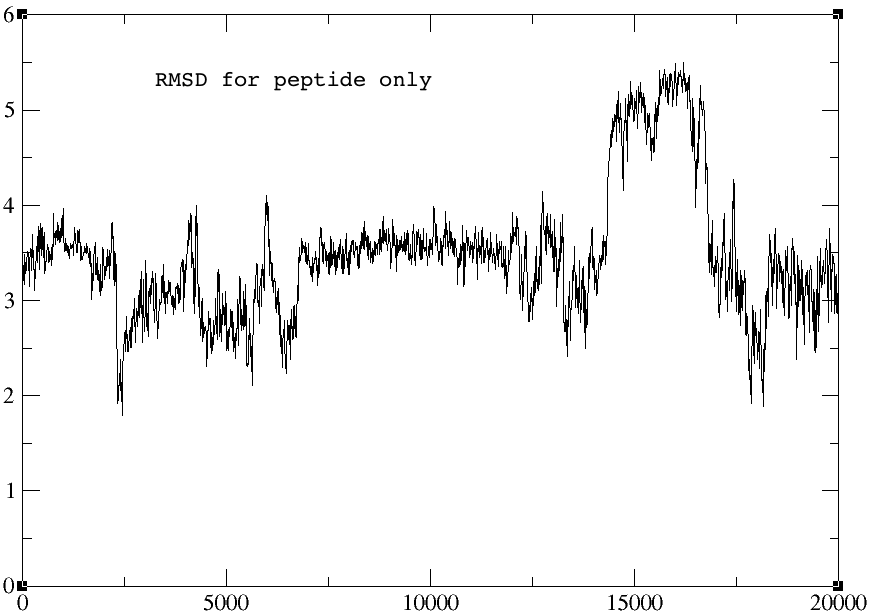
> Thank you for your reply, I have read the papers as suggested, and i found
> that the peak in my rmsd plot is somewhat different than the one shown in
> the paper. So i am suspecting that my peptide did dissociate from the
> receptor... and this is strange, as the peptide was shown to has highest
> inhibition activity compare to others.
>
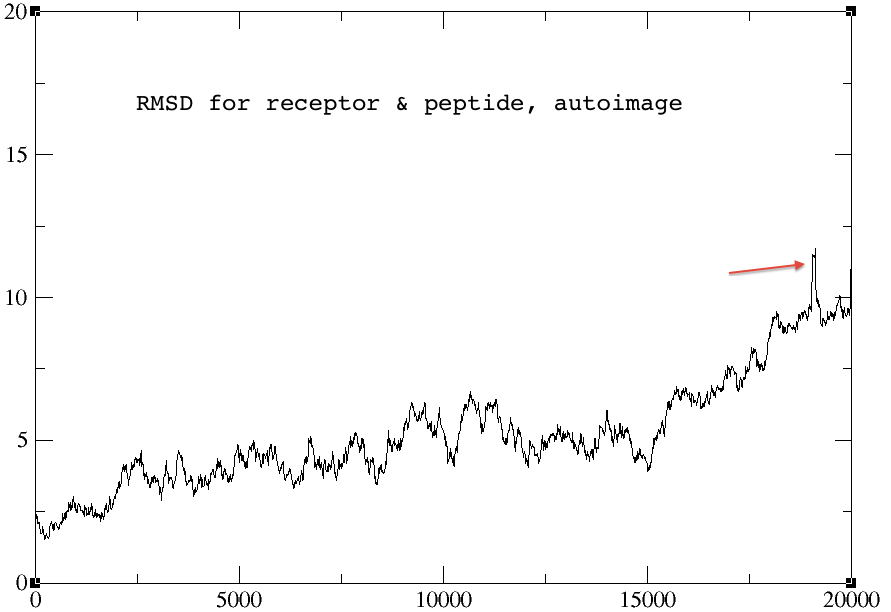
> I did some experiment using 1. autoimage, 2. center origin + image
> familiar, and 3. without any reimage keyword.
>
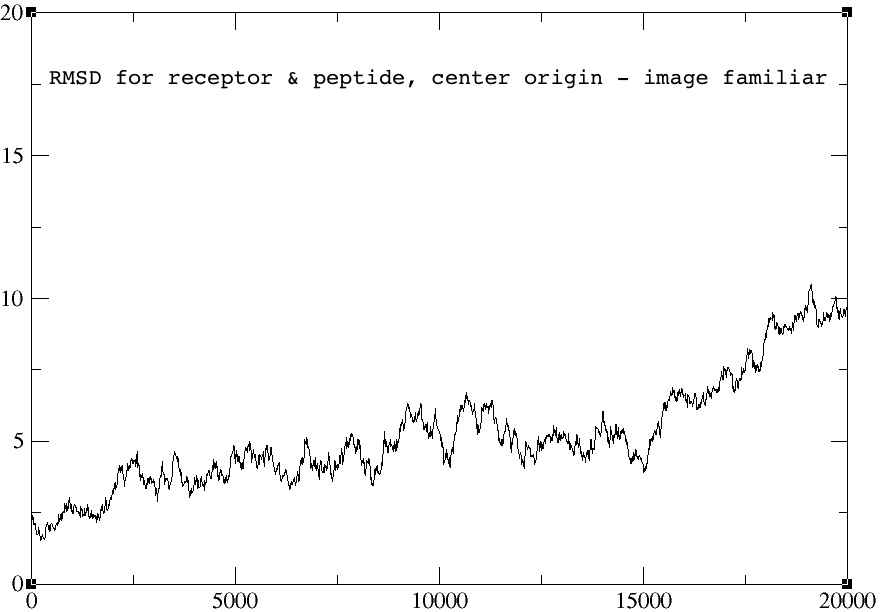
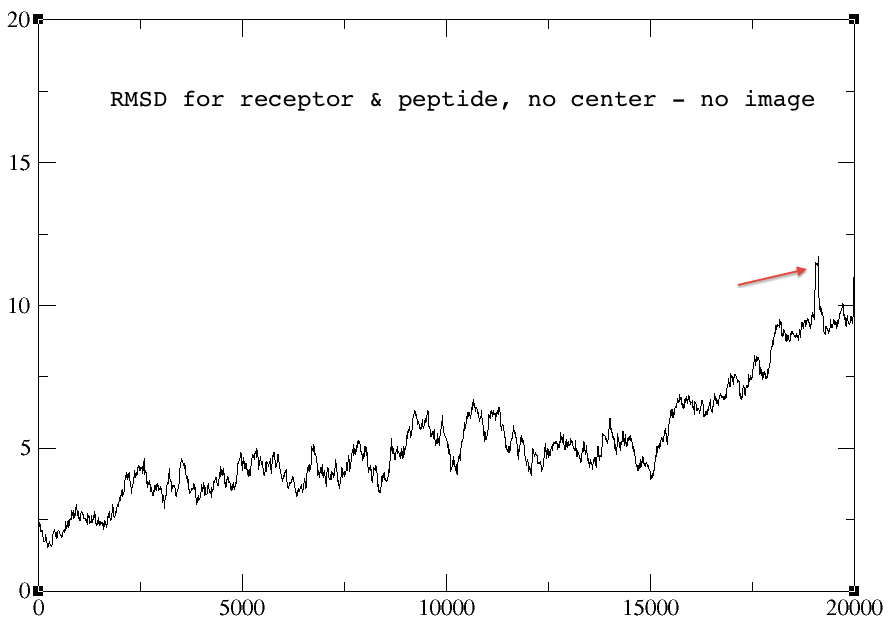
> The rmsd plots for the autoimage and without reimage keyword are
> identical, but the one using center origin + image familiar has no sharp
> peak towards the end of the graph (red arrow). I am not sure why... The
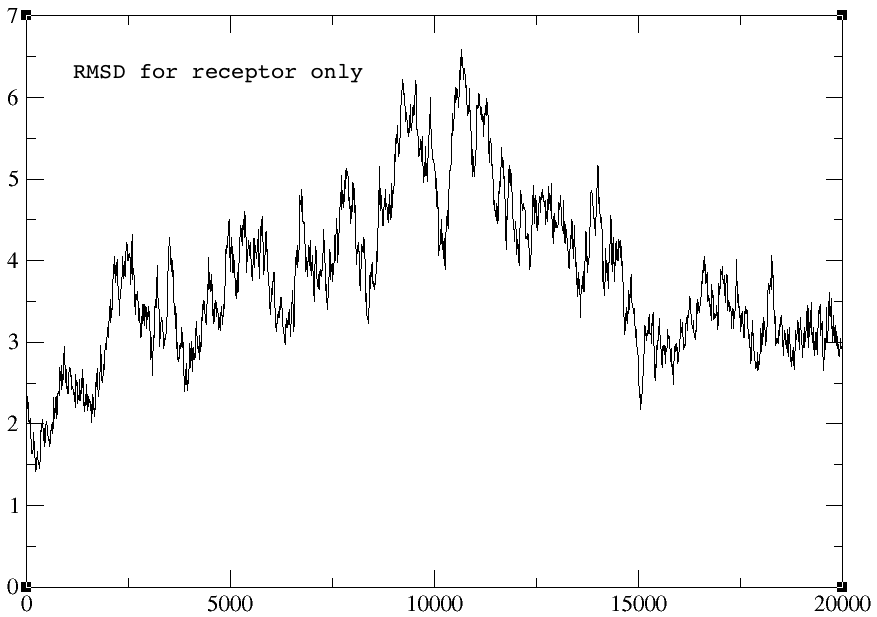
> rmsd plots for peptide alone and receptor alone are all identical for the
> three cases.
>
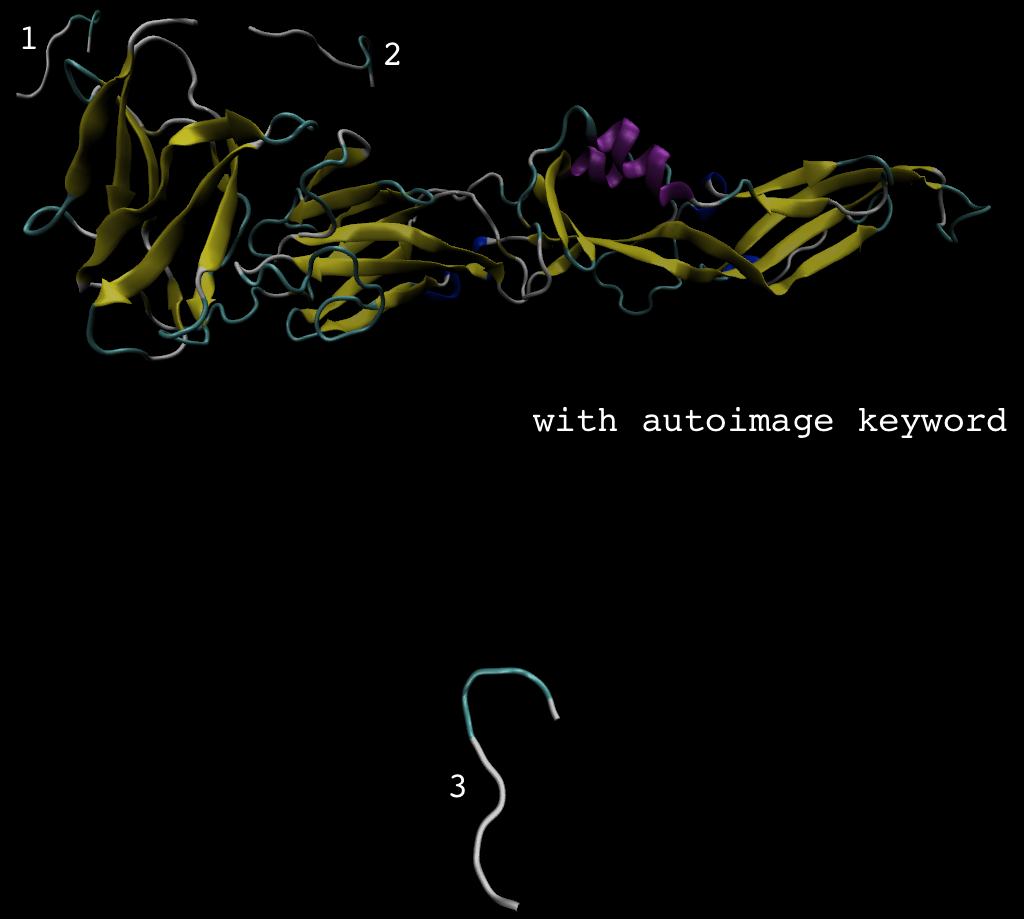
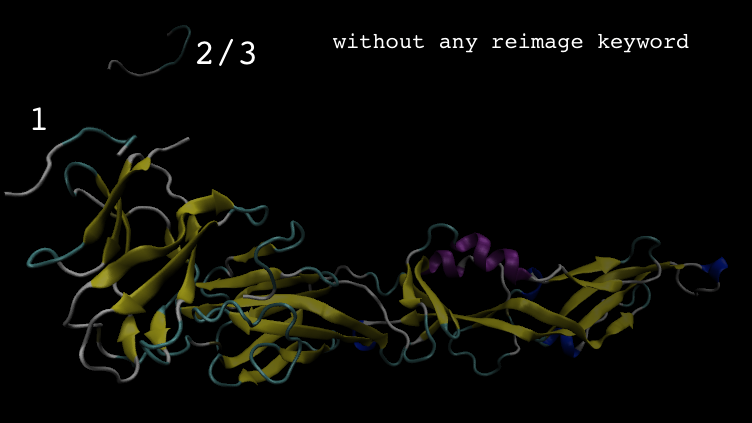
> The trajectory movie without any processing, showed that the peptide
> dissociated, and the trajectory with autoimage processing, also showed that
> the peptide dissociated, but the peptide was at the other side of receptor
> (see image, location 3). I feel strange, and confuse...
>
> Pls enlighten me. Thank you!
>
>
>
>
>
>
>
>
>
>
>
>
>
>
>
>
>
>
>
>
> On Thu, Jun 16, 2016 at 6:31 PM, Dr. Anselm Horn <anselm.horn.fau.de>
> wrote:
>
>> > I am simulating a peptide that has known activity to a receptor, but
>> > throughout the 20ns simulations, the peptide is no longer at the binding
>> > site, pls see the image below, on how the peptide moved out from the
>> > binding site to location 3.
>> >
>> > Is this something to do with the trajectory imaging? I have tried 1.
>> > autoimage and 2. center, image familiar, and both gave the same output.
>> >
>> > Or the peptide just doesn't fit to the binding site? The energy at the
>> last
>> > .out file is still negative.
>>
>> Normally, you can distinguish a true dissociation event from an imaging
>> issue by watching the trajectory in a viewing program (like VMD):
>> dissociation occurs most often in several visible steps (unless your
>> frame intervall is too large and your bound ligand too small), whereas
>> imaging causes an instantaneous, several Angstroem-long jump of the
>> ligand between two trajectory frames, i.e. from one side of the
>> simulation box to the other.
>>
>> Another hint is the graph RMSD vs time: If you observe instantanous
>> jumps in the plot of serveral Angstroems in height, this is indicative
>> of an imaging issue. (See e.g. DOI 10.1007/s00044-014-1135-5 for an
>> illustration of the imaging topic.)
>>
>> The energy in the out file is the total system energy including the
>> solvent-solvent and solvent-solute contribution; thus it cannot used
>> simply to monitor dissociation events. For this, you could utilize the
>> linear interaction energy (LIE) between the ligand and the parent
>> protein, easily calculated via cpptraj: In case of a dissociation, a
>> gradual decrease of interaction energy is expected.
>>
>> Regards,
>>
>> Anselm
>>
>>
>>
>>
>>
>> _______________________________________________
>> AMBER mailing list
>> AMBER.ambermd.org
>> http://lists.ambermd.org/mailman/listinfo/amber
>>
>
>
_______________________________________________
AMBER mailing list
AMBER.ambermd.org
http://lists.ambermd.org/mailman/listinfo/amber
(image/png attachment: no-center-no-image-pep.png)
(image/png attachment: autoimage.png)
(image/png attachment: no-center-no-image-rec.png)
(image/png attachment: 3-auto.png)
(image/png attachment: centerori-imagefam.png)
(image/png attachment: 3-noimage.png)
(image/png attachment: no-center-no-image.png)
