Date: Wed, 10 Jul 2013 15:58:38 +0200
Hello,
an update:
I took the input (including a binary restart file) from a simulation
that failed as described before and re-ran it on the exact same machine
and GPU. It did not crash, so it is not easy for me to make any
systematic checks.
The simulation before locked up after time step 3536000 (this is the
last output in the mdout file). I compared both mdout files (of the
crashed simulation and of the complete simulation) up to this time step.
All numerical values in the ASCII files were identical. I then compared
the coordinates in both trajectories up to this time step. They are
bitwise identical. Because I found that this is an interesting problem,
I've written a small article about how to validate partial bitwise
identity of coordinates in two NetCDF files:
http://gehrcke.de/2013/07/bitwise-identity-of-netcdf-data-hashing-numpy-arrays/
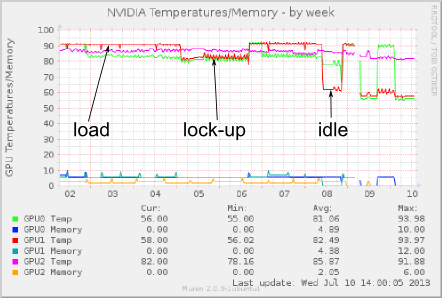
Regarding the temperature during the lock-up state, look at this graph:
http://gehrcke.de/files/perm/cuda_device_temp_week_gpu_lockup_amber_label.png
(I have also attached it). It's definitely cooler than under load, but
still hot.
Ross, since I currently cannot really reproduce this issue in a reliable
fashion, it does not really make sense to try the code change you
suggested, right?
Since Amber and CUDA device seem to have worked properly until the last
frame write of the locked-up simulation, there are two options I believe:
1) A sudden environment change irritated the GPU, such as a temperature
or voltage change.
2) Either Amber or the CUDA device went crazy, but it must have happened
after the last output write. I am using ntpr = 2000, ntwx = 2000.
Cheers,
JP
On 07/09/2013 09:57 PM, Ross Walker wrote:
> Hi Jan-Philip
>
> Hmmmm. I thought we'd worked around all the GTX580 problems. Maybe one
> crept back in with recent updates. Can you try doing the following:
>
> cd $AMBERHOME
> make clean
> ./configure -cuda gnu
>
> Then edit config.h
>
> And modify the following line from:
>
> PMEMD_CU_DEFINES=-DCUDA -Duse_SPFP
>
> to
>
> PMEMD_CU_DEFINES=-DCUDA -Duse_SPFP -DNODPTEXTURE
>
> Then
>
> make install
>
> And see if the problem goes away. At least for single GPU runs.
>
> All the best
> Ross
>
>
>
> On 7/9/13 10:31 AM, "Jan-Philip Gehrcke" <jgehrcke.googlemail.com> wrote:
>
>> Hello,
>>
>> we're running a cluster with a couple of Tesla C2070 as well as GTX 580
>> cards with newest GPU code of Amber 12 (as of today). Within the past
>> weeks I sometimes observed frozen or locked up / hung up GPU jobs with
>> the same symptoms as described by Mona (no output written anymore). In
>> fact, I am now in the process of systematically collecting information
>> about this issue and my plan was to consult the Amber community within
>> the next days to ask for help and recommendations. Currently, I try to
>> find out if this issue is reproducible or not. I also want to run the
>> reproducibility tests mentioned various times in the other discussion
>> about the issue related to the GTX Titans in order to see if our
>> hardware fulfills this condition or if it must be considered unreliable
>> per se.
>>
>> What I know so far: this only happened with jobs running on the GTX 580
>> cards. In these erroneous state, the pmemd.cuda process still consumes
>> 100 % CPU, but no output becomes written anymore. This state lasts
>> forever until the pmemd.cuda process becomes actively killed. After
>> that, the affected GPU is immediately able to run another job without
>> obvious problems. If idle, the GTX580s we're using have a temperature of
>> about 50 degrees. If under load, they have about 90 degrees. They are in
>> a cooled rack, so conditions are pretty stable. That's why I believe to
>> have observed that in the erroneous state as described above they are a
>> few -- maybe 5 -- degrees cooler than 90 degrees (we monitor
>> temperatures with munin). Meaning: when in error state they are
>> basically as hot as under load which would support your observation
>> that they are still doing something (if our two observations are
>> comparable at all), but maybe just a tiny bit cooler, which might be a
>> helpful indication to an expert.
>>
>> In a comparable discussion, using the latest code version was the
>> solution to a similar problem: http://archive.ambermd.org/201110/0387.html
>>
>> Looks like this is not the case for 'our' problem here.
>>
>> I will get back to the mailing list when I have more information.
>>
>> Cheers,
>>
>> JP
>>
>>
>> On 09.07.2013 18:42, Mona Minkara wrote:
>>> Hi,
>>> On numerous occasions I have run AMBER jobs on a GPU which, although
>>> they
>>> appear to be running, fail to write output. Our HPC staff suggests
>>> that:
>>>
>>> It seems to be running, although I do see that it
>>> keeps calling cudaThreadSynchronize in gpu_calculate_kinetic_energy_.
>>> Similar
>>> with the two GPU case, it might be looping over some calls.
>>>
>>>
>>>
>>> If anyone has encountered this type of problem with GPU jobs failing to
>>> write please let me know if there are suggestions for fixing this or if
>>> there is a bug fix.
>>>
>>> Thanks,
>>>
>>> Mona
>>> _______________________________________________
>>> AMBER mailing list
>>> AMBER.ambermd.org
>>> http://lists.ambermd.org/mailman/listinfo/amber
>>>
>>
>>
>> _______________________________________________
>> AMBER mailing list
>> AMBER.ambermd.org
>> http://lists.ambermd.org/mailman/listinfo/amber
>
>
>
> _______________________________________________
> AMBER mailing list
> AMBER.ambermd.org
> http://lists.ambermd.org/mailman/listinfo/amber
>
_______________________________________________
AMBER mailing list
AMBER.ambermd.org
http://lists.ambermd.org/mailman/listinfo/amber
(image/png attachment: cuda_device_temp_week_gpu_lockup_amber_label.png)
