Date: Wed, 9 Dec 2020 13:44:49 +0000
I am seeing negative values above some distance for some analyses
[cid:D991A27E-C1CC-41C3-B5D0-ADE86FB57B56.client.lnu.se]
https://imagebin.ca/v/5k8ypsFN7NxJ
Analyses are run specifying residues as solvent/solute masks (:XXX) without atom detail.
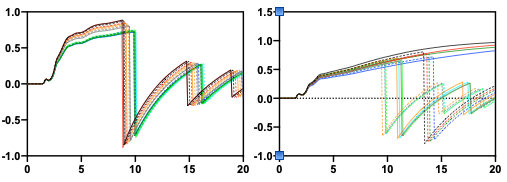
This seems to happen in larger systems with a high number of solvent and solute. In the left figure, say 200 solutes and 30000 water (a number of other molecules are included in the system making water:non-water about 50/50 by volume). In the right figure, results are from a simulated titration. The functions dropping to negative values at the shortest distances represent those with the highest number of “solute” molecules, 50 larger structures. Functions then dropp below zero at longer distances as the number of solute molecules are decreased. The four functions not dropping at all are those with the lowest number of "solute” molecules, 5.
Is this a problem based on values calculated producing some strange behaviour or is this a problem with imaging and analyses? The graphs are from the same series of simulations and there is a big size difference between the solute analysed to the left and the one to the right, yet both display seemingly similar behaviour.
Any suggestions/input would be appreciated
Best regards
// Gustaf
_______________________________________________
AMBER mailing list
AMBER.ambermd.org
http://lists.ambermd.org/mailman/listinfo/amber
(image/png attachment: rdfs.png)
