Date: Thu, 18 Apr 2019 15:35:43 -0400
Hi Daniel,
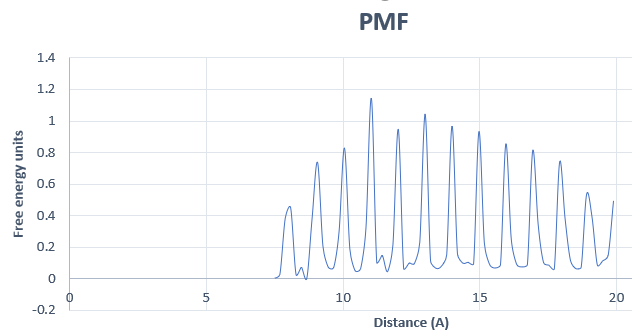
Your PMF indeed looks very periodic, which is usually a symptom of some
underlying problem with your umbrella sampling or WHAM inputs. I have
produced similar (incorrect) PMFs with that kind of periodicity in two
circumstances, once was when I ran umbrella sampling with varying r1 and r4
values across the different windows. I couldn't tell from your last email
-- do these runs you're showing here use different r1 and r4 values across
the windows, or did you change them to be constant? And when running WHAM,
you didn't by chance turn on periodicity?
The other time I got PMFs like that was when my WHAM inputs were wrong. Are
your data files separate for each window? Try plotting each window
separately. And just in case, when running WHAM each of your windows should
have its own file containing the distances throughout that window's
trajectory, not a single file containing the distances for every window.
Along those lines, is there any chance your metadata file has wrong target
values or force constants for any windows?
Also, try looking at orthogonal degrees of freedom other than the distance
you're running umbrella sampling on. Maybe take a look at peptide
end-to-end distances, rmsd to the initial conformation, phi/psi values for
a specific dihedral, etc. You want to make sure that other orthogonal
characteristics of your system overlap with adjacent windows, not just the
coordinate you're running umbrella sampling on. Seems like 5 ns would not
be long enough to sample a 20-residue peptide at each window, but I lack
the context of your system.
Finally, I'm attaching a Python script below that you can use to plot
histograms. It takes as input 60 x-y space-delimited column files, as well
as a name for your output file.
Hope this helps,
--Zachary
On Thu, Apr 18, 2019 at 2:28 PM Daniel Fernández Remacha <
dnlfr1994.gmail.com> wrote:
> Hi Zachary
>
> The peptide is about 20 residues long and we are using an alpha carbon of
> one of the residues of the peptide to separate it from the CoM of several
> alpha carbons in the protein.
>
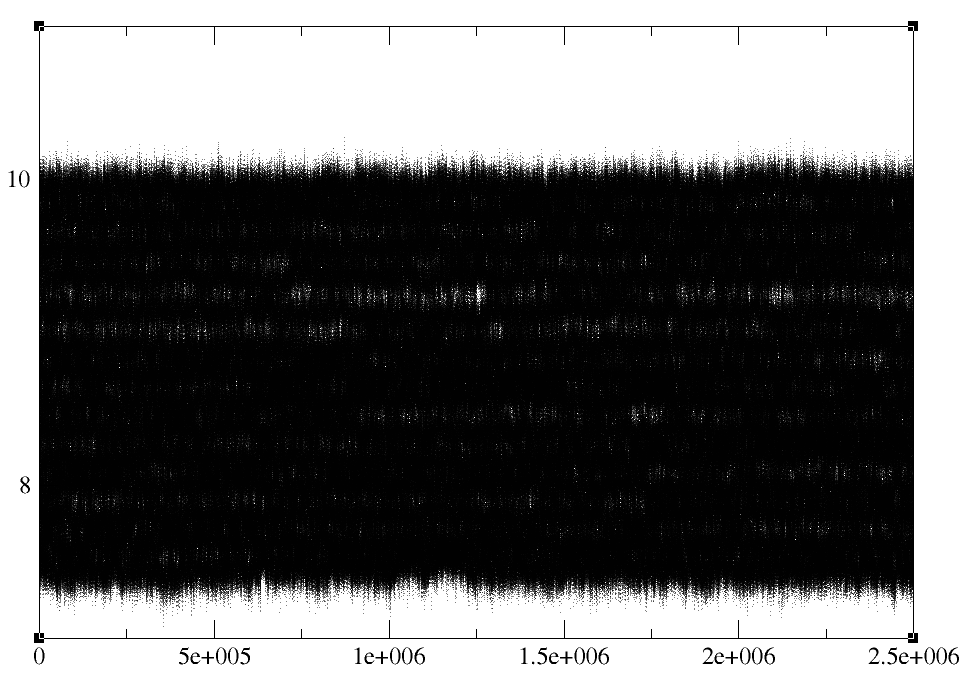
> By the density of the points we are getting with 5ns production, I would
> say that sampling is enough. Let me show you a picture of a small part of
> this umbrella. (XmGrace representation in "segment" setting with Dot width
> of 0.5)
> [image: image.png]
>
> What do you think? We guessed from this, that overlap between windows and
> sampling are OK; maybe a bit more sampling would be better, but I think
> this should do. However, I would still like to check histogram overlaying,
> as shown in the tutorial. I am having problems to obtain this plot though.
> Do you know of any script that could do this easily for about 60 windows?
>
> Also, this is the PMF that we get with 64 windows. Just in case it gives a
> better idea of what the problem may be.
> [image: image.png]
>
> Thank you very much for your help!! Really appreciated!
>
> Daniel Fernández
>
>
>
>
> El mié., 17 abr. 2019 a las 19:22, Zachary Fallon (<
> zachary.fallon.stonybrook.edu>) escribió:
>
>> Hi Daniel,
>>
>> I was actually just talking to someone about a system similar to yours
>> the other day -- specifically pulling a peptide out of a protein pocket.
>> Using umbrella sampling for this is tricky because, if I recall my
>> conversation correctly, not only do you have to sample each distance
>> sufficiently, but you also have to sample every conformation of the peptide
>> at each distance. Depending on the size of your peptide this may be
>> challenging to insurmountable, I believe we concluded that using something
>> like accelerated MD might be better for this application, but you may have
>> to consult the literature to see what others have done in similar systems.
>> Other users can correct me if I am off base here.
>>
>> Regarding starting your next window with the previous one's final rst
>> coordinates, that seems reasonable to me and I believe many people do it
>> that way, so you should be safe there. Are you using single atom distance
>> restraints, or center of mass distance restraints? CoM would probably be
>> preferable in your situation.
>>
>> Finally, regarding your force constant, I believe you have that correct.
>> I don't think any conversion is needed if you are calculating distances,
>> other than multiplying the force constant by two for WHAM.
>>
>> Hope this helps.
>>
>> Best regards,
>>
>> Zachary Fallon
>>
>> On Wed, Apr 17, 2019 at 6:59 AM Daniel Fernández Remacha <
>> dnlfr1994.gmail.com> wrote:
>>
>>> Hi!
>>>
>>> Thank you very much for your answers!!
>>>
>>> It is our first time in the group using umbrella sampling and WHAM, so
>>> any idea is absolutely appreciated.
>>> To give you a little more context of the system, our idea is to separate
>>> a quite flexible peptide from the protein, from an initial distance of
>>> about 7 angstroms to 20 or so, to achieve a full separation of both
>>> molecules.
>>>
>>> For each increment of 0.2, r1 & r4 move 1unit above and below. We used
>>> this because we thought this way the umbrella potential would be always
>>> symmetrical and equal for each window, allowing sampling with the same
>>> restrictions, and thus, pulling would not alter too much the structure of
>>> the protein. It is more restrictive though.
>>> However, this needed what I mentioned at the end of my previous mail,
>>> which makes sense to me but I am not sure if it is correct. Is it right
>>> to start f.i. the second window (min-equil-prod) from the last prod.rst of
>>> the previous one? I suppose this may be unnecessary if y set r1= 1 and r4=
>>> 90, since the borders always include de starting coordinates.
>>>
>>> I will try to simulate the umbrella with the conditions you mention and
>>> compare the results!
>>>
>>> Concerning WHAM, the only thing I suspect from is the restraint force. The
>>> AMBER Advanced Tutorial 17 uses the same force as that used for the
>>> umbrella and then multiplies by 2 and applies the conversion to degrees^2.
>>> Is any conversion needed if distance is used instead of an angle? Am I
>>> right if I say that using rk2=rk3=50 kcal/mol/ang, WHAM needs a force
>>> double of what I used in AMBER? This is: 100kcal/mol/ang? No conversion
>>> needed?
>>>
>>> Thank you very much again
>>>
>>> Daniel Fernández
>>>
>>>
>>>
>>> El mar., 16 abr. 2019 21:23, Zachary Fallon <
>>> zachary.fallon.stonybrook.edu> escribió:
>>>
>>>> Hi Daniel,
>>>>
>>>> I only have a little experience with WHAM analysis, so I would wager
>>>> some of the more veteran users can weigh in here if I miss anything.
>>>>
>>>> Am I understanding you correctly that you varied your r1 and r4 values
>>>> across the different windows? If you go back through the list serve there
>>>> is a good amount of discussion on what to set the r1 and r4 values, and I
>>>> *believe* they should be constant across all of your windows ( I faced
>>>> similar issues as you when I varied my r1 and r4 across windows ). If this
>>>> is wrong I would love for someone to correct me.
>>>>
>>>> Additionally it is typically suggested that your r1 and r4 values be
>>>> 'far away' from your r2/r3 values, to ensure your potential is harmonic at
>>>> the sampled values of your defined coordinate. It is common to set r1 = 1.0
>>>> or 0.0, and r4 to be some very large number (99.0 or 999). Check out the
>>>> Amber list serve archive for more details on how others have done this,
>>>> like this thread: http://archive.ambermd.org/200705/0113.html.
>>>>
>>>> It is possible that having the r1 and r4 values vary across your
>>>> windows, as well as them being so close to your sampled region, is what is
>>>> causing you trouble. Without knowing much else about your system or setup,
>>>> that is where I would look first. Unfortunately that likely means rerunning
>>>> your simulations.
>>>>
>>>> Finally, it is striking that your system requires a *minimum *of 50
>>>> kcal/(mol*A^2) to maintain your fixed distances. That is a big energy
>>>> penalty, and obviously it may make sense in the context of your system, but
>>>> it sticks out to me as unusual -- whatever barrier you are sampling must be
>>>> huge.
>>>>
>>>> Hope this helps, best of luck!
>>>>
>>>> --Zachary Fallon
>>>>
>>>> On Sat, Apr 13, 2019 at 9:20 AM Daniel Fernández Remacha <
>>>> dnlfr1994.gmail.com> wrote:
>>>>
>>>>> Hi!!
>>>>>
>>>>> I am a student doing a Master Program in Pharmaceutical Chemistry and
>>>>> I am
>>>>> writing to get some advice on understanding the results given by WHAM
>>>>> after
>>>>> doing an Umbrella Sampling of a dissociation process in a protein (600
>>>>> residues approx.)-peptide interaction.
>>>>>
>>>>> To separate these molecules, a force constant of 50kcal/mol/ang2 (the
>>>>> smallest that can keep the distance reasonably steady) is set, and r1
>>>>> and
>>>>> r4 values fixed at -1 and +1 unit of each r2=r3 value for every (5 ns
>>>>> production) window. The increment of distance separation from window to
>>>>> window is 0.2 angstroms.
>>>>>
>>>>> The combination of the MD gives a comprehensive separation movement
>>>>> when
>>>>> visualized in VMD and umbrella sampling looks nice since the overlap
>>>>> of the
>>>>> simulated windows looks adequate. It is much more full of dots than the
>>>>> example of the tutorial.
>>>>>
>>>>> However, I am having difficulties to understand WHAM results.
>>>>> When looking at the result.dat (as it is called in the AMBER advanced
>>>>> tutorial 17) we get the following data.
>>>>>
>>>>> #Coor Free +/- Prob +/-
>>>>> 7.492857 0.000000 0.000089 0.078953 0.000015
>>>>> 7.678571 0.021163 0.000114 0.076200 0.000018
>>>>> 7.864286 0.048638 0.000050 0.072768 0.000005
>>>>> 8.050000 0.035474 0.000201 0.074392 0.000012
>>>>> 8.235714 0.025529 0.000203 0.075644 0.000032
>>>>> 8.421429 0.074532 0.000235 0.069675 0.000034
>>>>> 8.607143 0.010492 0.000132 0.077576 0.000021
>>>>> 8.792857 0.031564 0.000090 0.074882 0.000009
>>>>> 8.978571 0.138947 0.000127 0.062539 0.000005
>>>>> 9.164286 0.160852 0.000055 0.060283 0.000007
>>>>> 9.350000 0.122887 0.000140 0.064246 0.000019
>>>>> 9.535714 0.063552 0.000138 0.070970 0.000021
>>>>> 9.721429 0.063538 0.000176 0.070971 0.000025
>>>>> 9.907143 0.064124 0.000422 0.070902 0.000016
>>>>> #Window Free +/-
>>>>> #0 0.000000 0.000000
>>>>> #1 0.000000 0.000000
>>>>> #2 0.000000 0.000000
>>>>> #3 0.015216 0.000000
>>>>> #4 0.000000 0.000000
>>>>> #5 0.000000 0.000000
>>>>> #6 0.000000 0.000000
>>>>> #7 0.000000 0.000000
>>>>> #8 0.010285 0.000000
>>>>> #9 0.000000 0.000000
>>>>> #10 0.000000 0.000000
>>>>> #11 0.000000 0.000000
>>>>> #12 0.000000 0.000000
>>>>> #13 0.034936 0.000000
>>>>>
>>>>> The main problem comes when looking at the Free energy, which is used
>>>>> to
>>>>> see whether the system has converged or not. In the WHAM manual, it is
>>>>> mentioned that when this F value is smaller than the specified
>>>>> tolerance
>>>>> the system has converged. The tolerance value set for these results is
>>>>> 10^-6.
>>>>>
>>>>> Moreover, when doing MonteCarlo Bootstrap analysis to look for
>>>>> similarities
>>>>> with the information given in the manual, we get 3 iterations; very
>>>>> different from the information given in the WHAM manual.
>>>>>
>>>>> I expected the system to be convergent due to a small increment value,
>>>>> enough simulation time and good overlapping between windows. However, I
>>>>> find strange to see these F values. The files present in the amber
>>>>> tutorial
>>>>> do not show these results ( #Window Free and +/-) and the WHAM manual
>>>>> does
>>>>> not give information about the example used so we do not have a solid
>>>>> criterion to understand these results.
>>>>>
>>>>> I would be really grateful if you could help me understand the meaning
>>>>> of
>>>>> these results for this system and provide any suggestion to perform a
>>>>> successful umbrella sampling.
>>>>>
>>>>> Thanks in advance,
>>>>>
>>>>> Daniel Fernández
>>>>>
>>>>> PD: We modified the Perl script for minimization, equilibration and
>>>>> production steps and our own script reads coordinates from the end of
>>>>> the
>>>>> last production .rst file window performed; and not from the original
>>>>> coordinates as shown in the tutorial. I am not sure if this is correct
>>>>> but
>>>>> we thought that this way the system would be less distorted when
>>>>> reaching
>>>>> high distance values for separation.
>>>>> _______________________________________________
>>>>> AMBER mailing list
>>>>> AMBER.ambermd.org
>>>>> http://lists.ambermd.org/mailman/listinfo/amber
>>>>>
>>>>
>>>>
>>>> --
>>>> Zachary Fallon, PhD Candidate
>>>> Dr. Carlos Simmerling Laboratory
>>>> The Laufer Center for Physical and Quantitative Biology
>>>> The Department of Chemistry, Stony Brook University
>>>> Stony Brook, New York 11794
>>>> Phone: (914) 703-1010 <(914)+703+1010> Email:
>>>> zachary.fallon.stonybrook. <zachary.fallon.stonybrook.edu>edu
>>>>
>>>
>>
>> --
>> Zachary Fallon, PhD Candidate
>> Dr. Carlos Simmerling Laboratory
>> The Laufer Center for Physical and Quantitative Biology
>> The Department of Chemistry, Stony Brook University
>> Stony Brook, New York 11794
>> Phone: (914) 703-1010 <(914)+703+1010> Email:
>> zachary.fallon.stonybrook. <zachary.fallon.stonybrook.edu>edu
>>
>
--
Zachary Fallon, PhD Candidate
Dr. Carlos Simmerling Laboratory
The Laufer Center for Physical and Quantitative Biology
The Department of Chemistry, Stony Brook University
Stony Brook, New York 11794
Phone: (914) 703-1010 <(914)+703+1010>  Email:  zachary.fallon.stonybrook.
<zachary.fallon.stonybrook.edu>edu
_______________________________________________
AMBER mailing list
AMBER.ambermd.org
http://lists.ambermd.org/mailman/listinfo/amber
(image/png attachment: image.png)
(image/png attachment: 02-image.png)
- text/plain attachment: plot60Hists.py
