Date: Tue, 31 Jul 2018 10:28:55 +0200
Dear Amber Users,
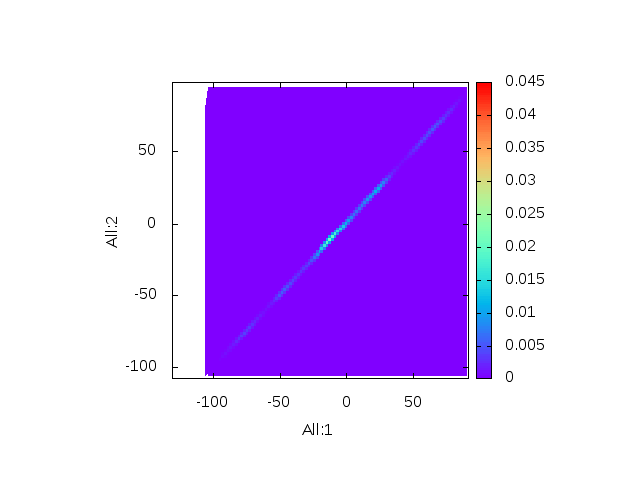
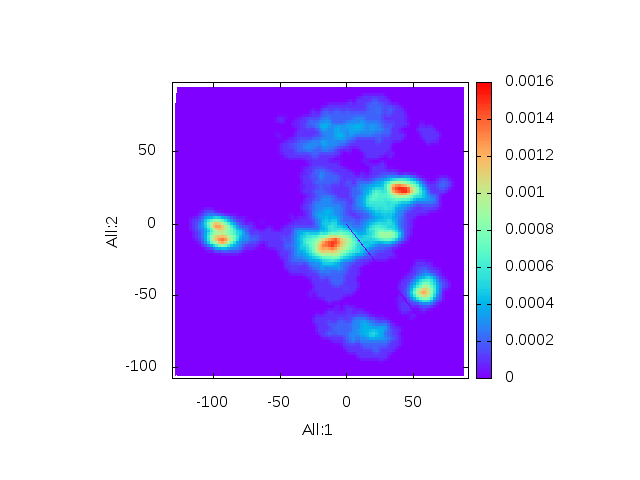
I've used cpptraj PCA tutorial to run PCA analysis of my system's
trajectories.
I've used
hist All:1 All:2 bins 100 out all-sim-c0_hist_1_2.gnu norm name All_1_2
to obtain the PC1 vs PC2 graph.
I've used similar command to obtain the PC2 vs PC3 graph and I'm confused
right now. Should the PCs be correlated or does that mean that I did
something very wrong?
I'm attaching both graphs.
Thank you for your help!
Best regards
Karolina Mitusińska
PhD student
_______________________________________________
AMBER mailing list
AMBER.ambermd.org
http://lists.ambermd.org/mailman/listinfo/amber
(image/png attachment: PC2vsPC3.png)
(image/png attachment: PC1vsPC2.png)
