Date: Mon, 11 Jun 2018 23:58:46 -0300
I made an adaptation of the script for my system:
http://www.amber.utah.edu/AMBER-workshop/London-2015/pca/
My script:
trajin 100ns.nc
rms first :1-543.CA
average crdset average
createcrd avg-trajectories
run
crdaction avg-trajectories rms ref average :1-543.CA
crdaction avg-trajectories matrix covar name ebd-covar :1-543.CA
runanalysis diagmatrix ebd-covar out ebd-evecs.dat \
vecs 3 name myEvecs
crdaction avg-trajectories projection CPU modes myEvecs \
beg 1 end 2 :1-543.CA crdframes
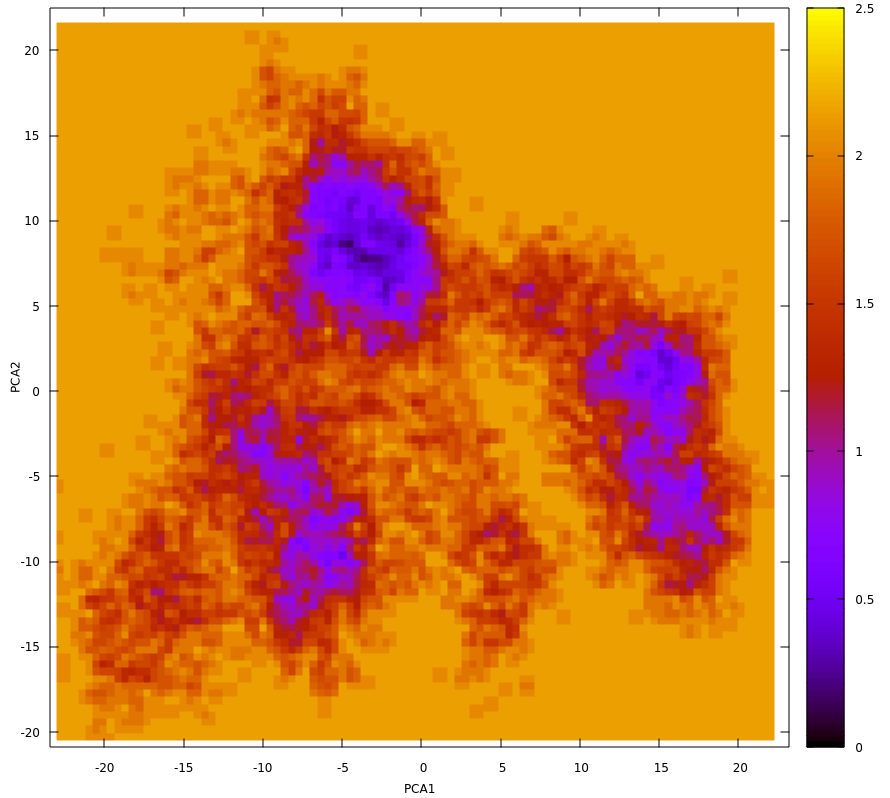
runanalysis hist CPU:1 CPU:2 free 300 bins 100 out PCA1xPCA2.gnu
run
Running: runanalysis hist CPU:1 CPU:2 free 300 bins 10
0 out PCA1vsPCA2.gnu
When to plot PCA1 vs PC2 will I get Free Energy Landscape (FEL)?
If that is not the way to get FEL you could teach me how to get?
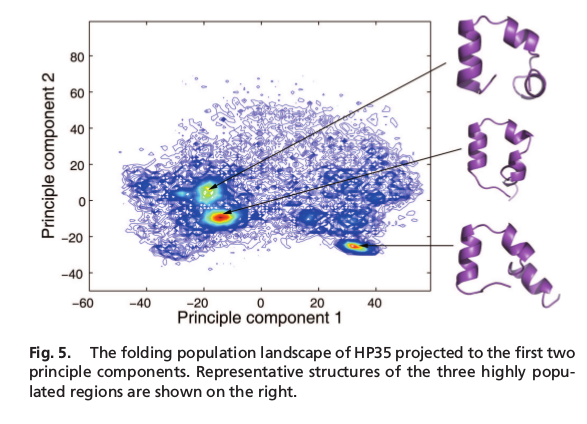
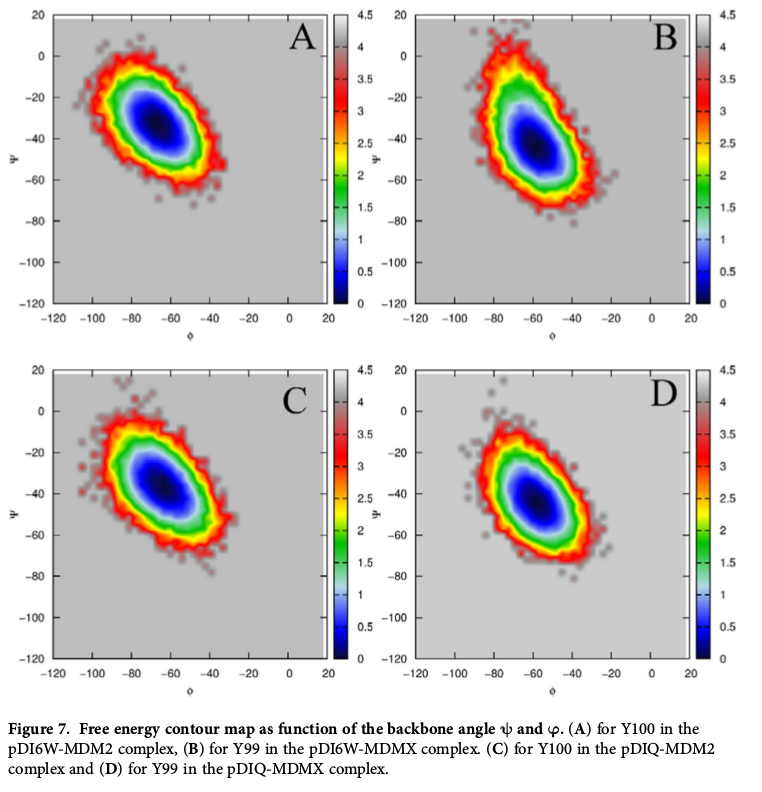
Another question ... How could I edit my PCA1vsPCA2 file (attached graphic)
so that it looks similar to the attached graphic? (Two examples attached)
_______________________________________________
AMBER mailing list
AMBER.ambermd.org
http://lists.ambermd.org/mailman/listinfo/amber

(image/png attachment: PCA1vsPCA2.png)

(image/png attachment: DOI:_10.1073_pnas.0608432104.png)

(image/png attachment: DOI:_10.1038_srep17421.png)
