From: Carlos Romero <carlos.rom.74he.gmail.com>
Date: Fri, 2 Dec 2016 00:39:53 -0600
Hi dear Amber User's.
have a nice day.
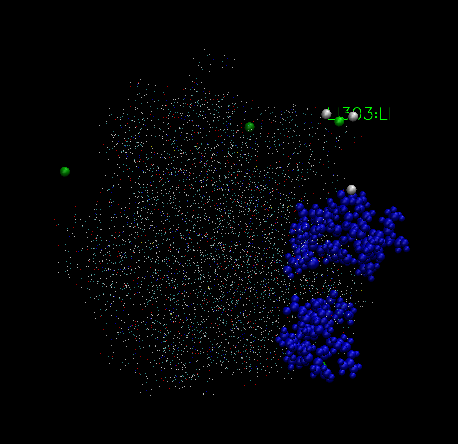
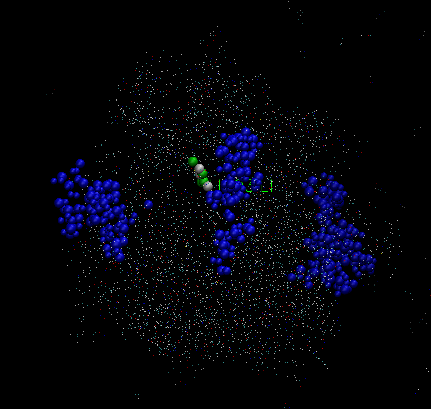
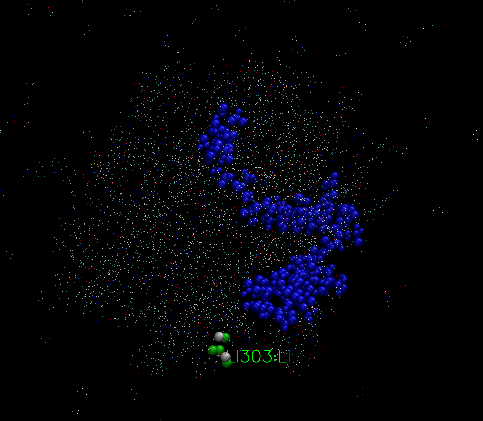
I am simulating thrombin in presence of Li+ ions.
I excecuted 750 000 steps MD, I got a stable MD according to EPTOT and ETOT
graphics, but when I analyzed with VMD, I saw something that I can not
undrestand,
In frame 1, the graphic is like figure VMD1, in frame 313, it is like VMD2
and the final frame, it looks like figure VMD3,
my question is, is it OK my simulation? or what can I understand according
to these figures.
Thanks in advance
Regards
_______________________________________________
AMBER mailing list
AMBER.ambermd.org
http://lists.ambermd.org/mailman/listinfo/amber
Received on Thu Dec 01 2016 - 23:00:02 PST