Date: Mon, 19 Oct 2015 17:30:48 +0100
Dear Amber experts,
I have been using for some time now a cpptraj script that calculates the
per-residue RMSF of my protein of interest. It's a trimeric protein with
standard amino acids, 419 in total. It has some regions that are
flexible and I usually take a look at the RMSF profile to quantify that.
I switched to AmberTools 15 soon after it was released.
The issue is that some days ago I ran the same cpptraj script I always
use to some new trajectories and saw a big increase in the RMSF profile.
These new trajectories were run with ff14SB forcefield, while the old
ones were run with ff99SB. I've been trying to narrow down what could
possibly be the source of change, but I've been unable to spot it.
Visualizing the new trajectories with Chimera or VMD showed no signs of
such a drastic increase in the RMSF values (similar kind of movements
when compared to the old ff99SB trajectories). What is more worrying, I
reran the same cpptraj commands on the old trajectories and got similar
bigger values as well (?!) This is what makes me think that there could
have been a change in the way cpptraj behaves.
Here's the commands I've been using to do this analysis. My idea is to
get an average structure of the backbone atoms of the full trajectory,
rms fit to that and then calculate the per-residue fluctuations:
> parm top.prmtop
> trajin 05_Production_*.nc
> loadtraj name loaded_trajs
> crdaction loaded_trajs average crdset average_structure .CA,C,O,N,H
> crdaction loaded_trajs rms ref average_structure .CA,C,O,N,H
> crdaction loaded_trajs atomicfluct out rmsf_OPT1.dat .CA,C,O,N,H byres
> run
Now, I've been playing around with cpptraj trying to solve this and
found that if I concatenate the trajectories together into one (I
usually have the runs split into chunks of 50 ns) and modify the
commands, I get an RMSF profile that is similar to what I used to obtain
(with the commands above, mind you) in terms of values and profile. This
second set of commands effectively do the same thing as the ones above,
only loading the full trajectory as a coords set and then outputting the
average structure.
> parm top.prmtop
> loadcrd full_lenght.nc
> crdaction full_lenght.nc average avg.pdb .CA,C,O,N,H
> parm avg.pdb
> reference avg.pdb parm avg.pdb
> crdaction full_lenght.nc rms reference .CA,C,O,N,H
> crdaction full_lenght.nc atomicfluct out rmsf_OPT2.dat .CA,C,O,N,H
> byres
> run
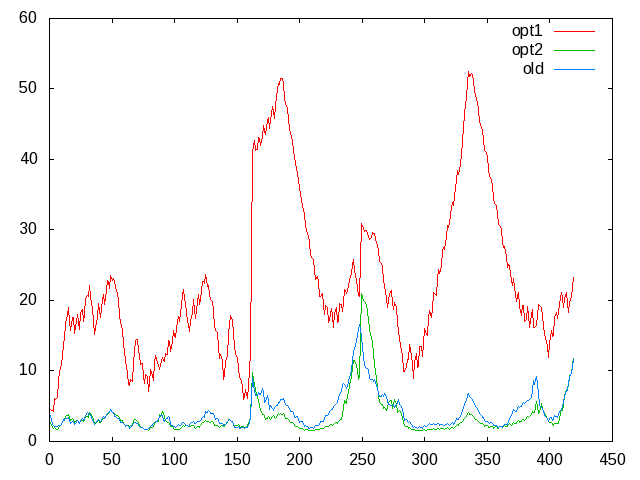
I'm attaching a plot showing the differences between the cpptraj
outputs. The red line (opt1) corresponds to the first cpptraj commands
on the new trajectories. The green line (opt2) corresponds to the second
commands on the same new data. The blue line is from another independent
old run.
I expect changes in the RMSF values and profiles between independent
runs, but not so big when the only thing I've done is changing the
forcefield. Also, running the same commands on old trajectories is also
generating different RMSF values than the ones I had previously done.
Could somebody give me their opinion on this?
All the best,
Juan
_______________________________________________
AMBER mailing list
AMBER.ambermd.org
http://lists.ambermd.org/mailman/listinfo/amber
(image/png attachment: rmsf_comparisons.png)
