Date: Fri, 27 Feb 2015 11:29:45 -0500
Thanks Ross and Ian,
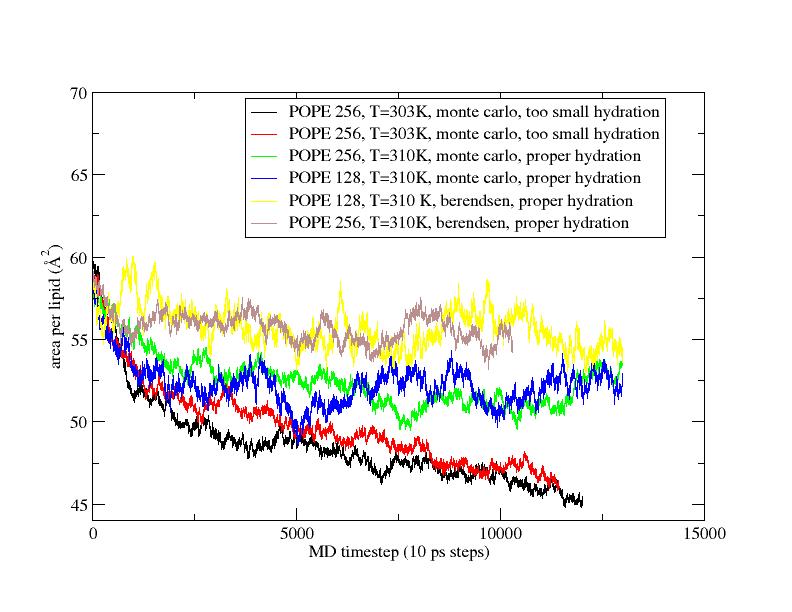
Wanted to give an update on my lipid tests in case it is useful. Here are
two figures for some POPE tests and a DOPC test. The POPE tests were done
with either monte carlo barostat or berendsen barostat (indicated on
figure). The two early tests that we did with a bad temperature for POPE
and low hydration were obviously bad. The monte carlo barostat results seem
to come in a little low on the area per lipid for POPE compared to
berendsen, but we're going to extend these a bit longer and see what
happens out to 250 ns.
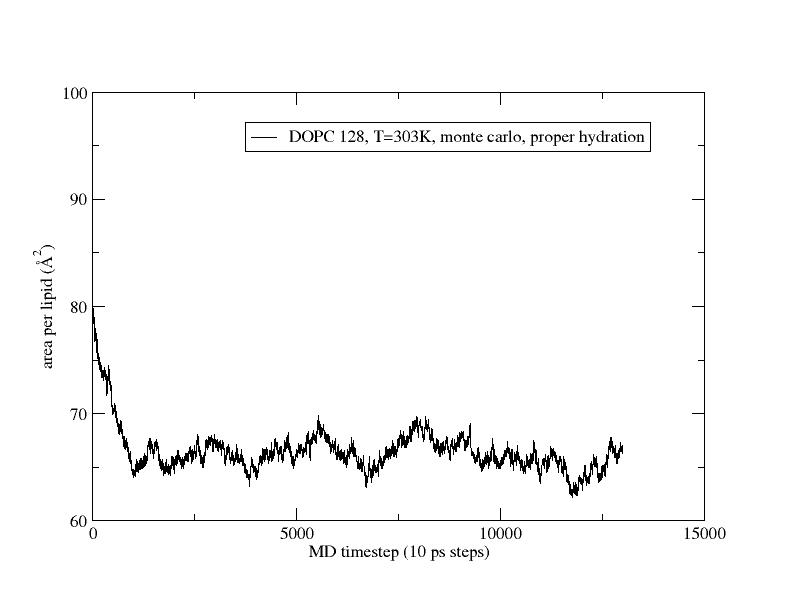
I also included a figure for DOPC (following the Lipid14 tutorial exactly
with Monte Carlo barostat), and you can see for DOPC the monte carlo
barostat seems to do quite well compared to the Berendsen result for area
per lipid from the Lipid 14 paper.
Joe
--
Joseph Baker, PhD
Assistant Professor
Department of Chemistry
C101 Science Complex
The College of New Jersey
Ewing, NJ 08628
Phone: (609) 771-3173
Web: http://bakerj.pages.tcnj.edu/
<https://sites.google.com/site/bakercompchemlab/>
On Fri, Feb 20, 2015 at 3:58 PM, Ross Walker <ross.rosswalker.co.uk> wrote:
> Hi Joe,
>
> I think you are short on convergence here - 60ns is a little on the short
> side. We ran most of the lipids for 125ns in the lipid14 testing - and
> extended most out to 250ns. We also ran multiple repeats since there is
> often fluctuation in the time it takes a given lipid bilayer to equilibrate.
>
> This was for systems half the size of yours so in your case equilibration
> will like take longer. So I'd take the black curve and run it 5x or so
> longer and see what you get.
>
> All the best
> Ross
>
> /\
> \/
> |\oss Walker
>
> ---------------------------------------------------------
> |             Associate Research Professor              |
> |            San Diego Supercomputer Center             |
> |             Adjunct Associate Professor               |
> |         Dept. of Chemistry and Biochemistry           |
> |          University of California San Diego           |
> |                     NVIDIA Fellow                     |
> | http://www.rosswalker.co.uk | http://www.wmd-lab.org  |
> | Tel: +1 858 822 0854 | EMail:- ross.rosswalker.co.uk  |
> ---------------------------------------------------------
>
> Note: Electronic Mail is not secure, has no guarantee of delivery, may not
> be read every day, and should not be used for urgent or sensitive issues.
>
> > On Feb 20, 2015, at 4:42 AM, Joseph Baker <bakerj.tcnj.edu> wrote:
> >
> > Hi all,
> >
> > I've been having one of my students run some test simulations of a pure
> > POPE bilayer in pmemd.cuda with Amber14 using the Lipid14 force field. My
> > student has been following the protocol in the Lipid14 tutorial online.
> > Attached is a figure to show the current area per lipid vs time (in
> > picoseconds) we are getting (plotted are the steps from the beginning of
> > the series of Hold steps during which the box size equilibrates, and the
> > production phase).
> >
> > I can explain why the green and red curves behave badly. For the green
> > curve my student accidentally only restrained half of the lipids during
> the
> > heating phase, we were also underhydrated (~ 26 waters/lipid instead of
> the
> > suggested 32/lipid in the Lipid14 paper for POPE), and we were running at
> > 303 K (instead of 310 K as suggested for POPE in the Lipid14 paper). The
> > red curve represents a simulation where we fixed the restraints step
> during
> > heating, but were still underhydrated and at a lower T.
> >
> > The black curve has appropriate hydration (enough waters in the system to
> > have at least 32 waters/lipid head), and we are now running at 310 K. It
> > seems that we are still getting a couple of angstrom^2 smaller area than
> is
> > reported in the Lipid14 paper however. I should note that our initial
> lipid
> > system was built using charmm-gui, it consists of 256 lipids instead of
> the
> > 128 in the Lipid14 paper, and we are using the monte carlo barostat
> instead
> > of the Berendsen barostat for production (so the same as in the tutorial,
> > but different from what was done in the paper). My guess is that none of
> > these factors are resulting in us being a little low on the area per
> lipid
> > however.
> >
> > Any suggestions would be appreciated! Thanks.
> >
> > Joe
> >
> > --
> > Joseph Baker, PhD
> > Assistant Professor
> > Department of Chemistry
> > C101 Science Complex
> > The College of New Jersey
> > Ewing, NJ 08628
> > Phone: (609) 771-3173
> > Web: http://bakerj.pages.tcnj.edu/
> > <https://sites.google.com/site/bakercompchemlab/>
> > <area_per_lipid.jpg>_______________________________________________
> > AMBER mailing list
> > AMBER.ambermd.org
> > http://lists.ambermd.org/mailman/listinfo/amber
>
>
> _______________________________________________
> AMBER mailing list
> AMBER.ambermd.org
> http://lists.ambermd.org/mailman/listinfo/amber
>
_______________________________________________
AMBER mailing list
AMBER.ambermd.org
http://lists.ambermd.org/mailman/listinfo/amber
(image/jpeg attachment: aplDOPC.jpg)
(image/jpeg attachment: aplPOPE.jpg)
