Date: Sun, 6 Jul 2008 00:59:57 -0600
I have run long MD simulations of a protein in explicit solvent (using
NMR distance restraints) and am attempting to calculate the order
parameter S2 for comparison with experimental data. I have, thus, used
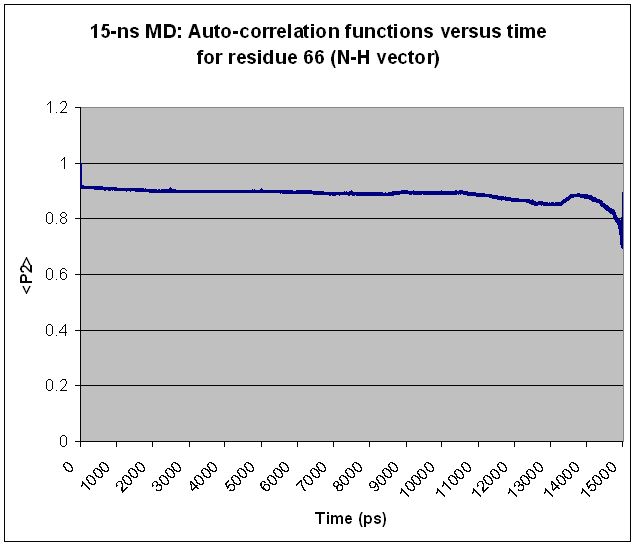
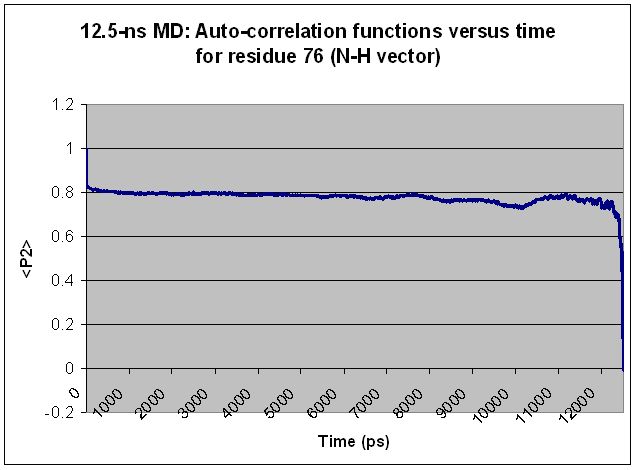
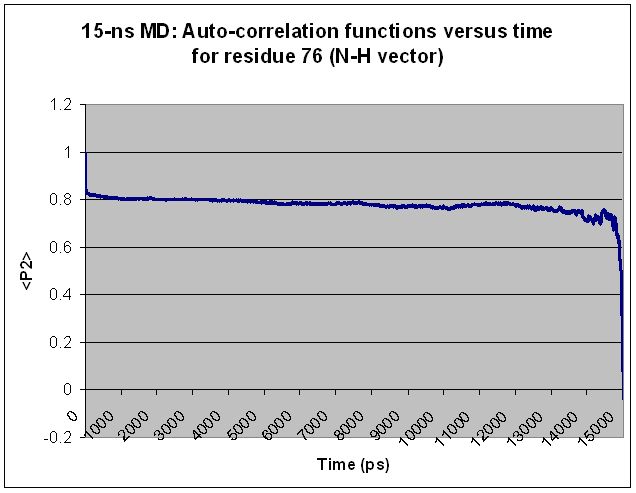
ptraj to calculate auto-correlation functions, <P2>, from which I
hoped to determine S2 values (as the long-time asymptote of <P2>).
However, I have found the <P2> data to be confusing.
Specifically, I find that every residue shows "volatility" in <P2>
toward the end of the simulation, regardless of simulation length and
regardless of the residue's relative mobility. Extending the
simulation merely shifts the volatile region over but does not change
the basic shape of the <P2> curve. For most residues, what appears to
be a volatile region in a shorter simulation becomes smooth as the
simulation is extended. Two examples are given below, along with the
input file used to generate the <P2> values for the longer simulation.
(Graphs are attached showing <P2> values calculated from 12.5-ns and
15-ns simulations for each of two different residues.)
ptraj input file for the 15-ns simulation:
=====
trajin ../wtligand-mod6_heat.mdcrd.gz
trajin ../wtligand-mod6_1st2500ps-rst.mdcrd.gz
trajin ../wtligand-mod6_2nd5000ps-rst.mdcrd.gz
trajin ../wtligand-mod6_3rd2500ps-rst.mdcrd.gz
trajin ../wtligand-mod6_4th2500ps-rst.mdcrd.gz
trajin ../wtligand-mod6_5th2500ps-rst.mdcrd.gz
rms first out wtligand-mod6_0-15020ps_core_op.rms :17-116.CA,C,N,O time 0.5
vector r2 :2.N corr :2.H
vector r4 :4.N corr :4.H
vector r5 :5.N corr :5.H
vector r6 :6.N corr :6.H
vector r7 :7.N corr :7.H
vector r8 :8.N corr :8.H
vector r9 :9.N corr :9.H
vector r10 :10.N corr :10.H
vector r11 :11.N corr :11.H
vector r12 :12.N corr :12.H
.
.
.
vector r127 :127.N corr :127.H
vector r128 :128.N corr :128.H
vector r130 :130.N corr :130.H
analyze timecorr vec1 r2 vec2 r2 out r002.nh tcorr 15020. tstep 0.5
analyze timecorr vec1 r4 vec2 r4 out r004.nh tcorr 15020. tstep 0.5
analyze timecorr vec1 r5 vec2 r5 out r005.nh tcorr 15020. tstep 0.5
analyze timecorr vec1 r6 vec2 r6 out r006.nh tcorr 15020. tstep 0.5
analyze timecorr vec1 r7 vec2 r7 out r007.nh tcorr 15020. tstep 0.5
analyze timecorr vec1 r8 vec2 r8 out r008.nh tcorr 15020. tstep 0.5
analyze timecorr vec1 r9 vec2 r9 out r009.nh tcorr 15020. tstep 0.5
analyze timecorr vec1 r10 vec2 r10 out r010.nh tcorr 15020. tstep 0.5
analyze timecorr vec1 r11 vec2 r11 out r011.nh tcorr 15020. tstep 0.5
analyze timecorr vec1 r12 vec2 r12 out r012.nh tcorr 15020. tstep 0.5
.
.
.
analyze timecorr vec1 r127 vec2 r127 out r127.nh tcorr 15020. tstep 0.5
analyze timecorr vec1 r128 vec2 r128 out r128.nh tcorr 15020. tstep 0.5
analyze timecorr vec1 r130 vec2 r130 out r130.nh tcorr 15020. tstep 0.5
go
-----------------------------------------------------------------------
The AMBER Mail Reflector
To post, send mail to amber.scripps.edu
To unsubscribe, send "unsubscribe amber" (in the *body* of the email)
to majordomo.scripps.edu

(image/jpeg attachment: residue66_12520ps.jpg)
(image/jpeg attachment: residue66_15020ps.jpg)
(image/jpeg attachment: residue76_12520ps.jpg)
(image/jpeg attachment: residue76_15020ps.jpg)
