Date: Thu, 4 Sep 2025 10:55:42 +0530
Respected Team,
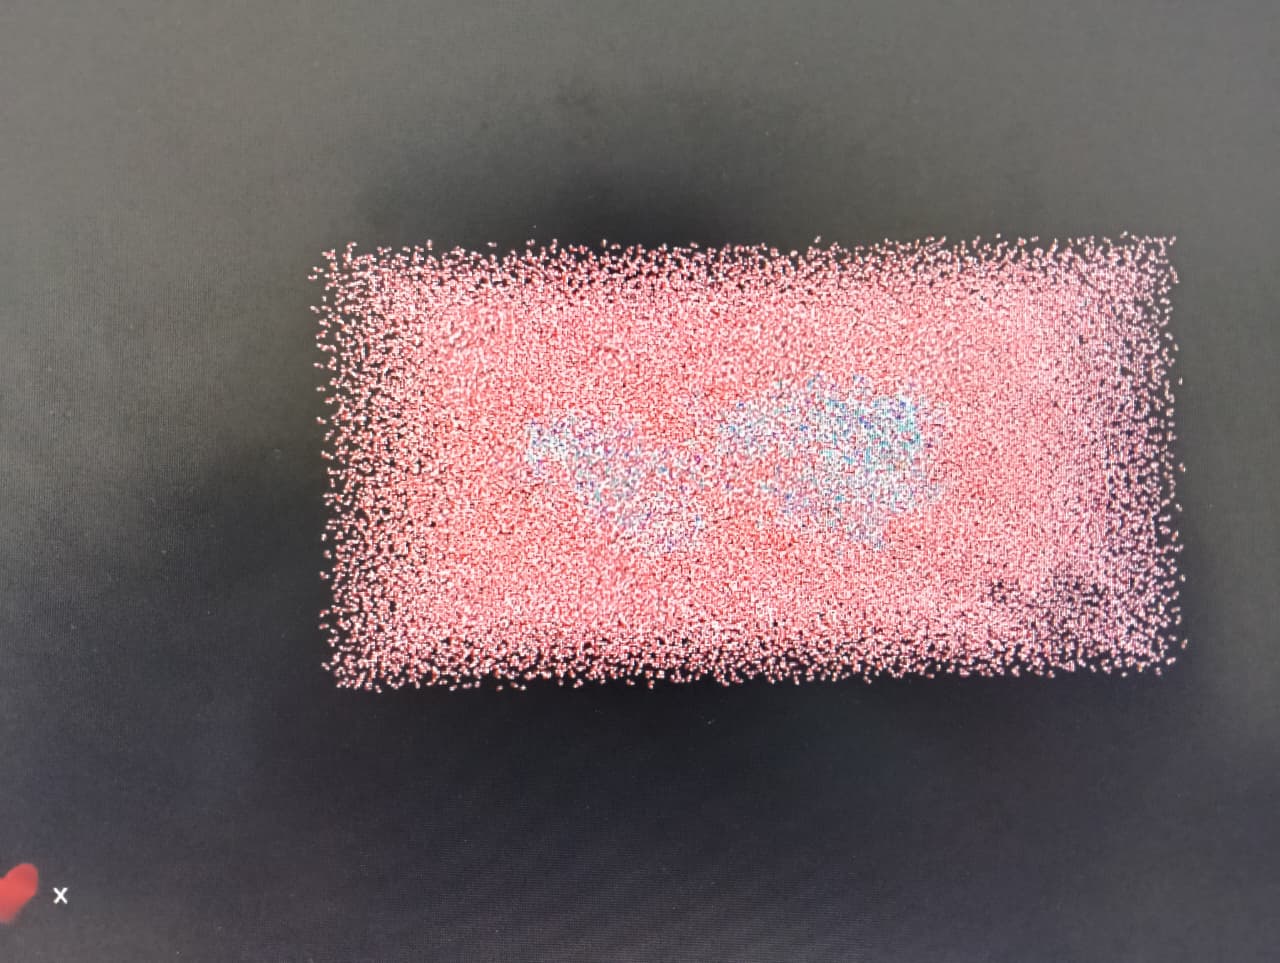
I am facing an issue while analyzing my trajectories. After running
equilibration under NVT (pmemd.cuda), I used cpptraj to convert the final
.rst7 file to .pdb. The structure looks abnormal (screenshot attached).
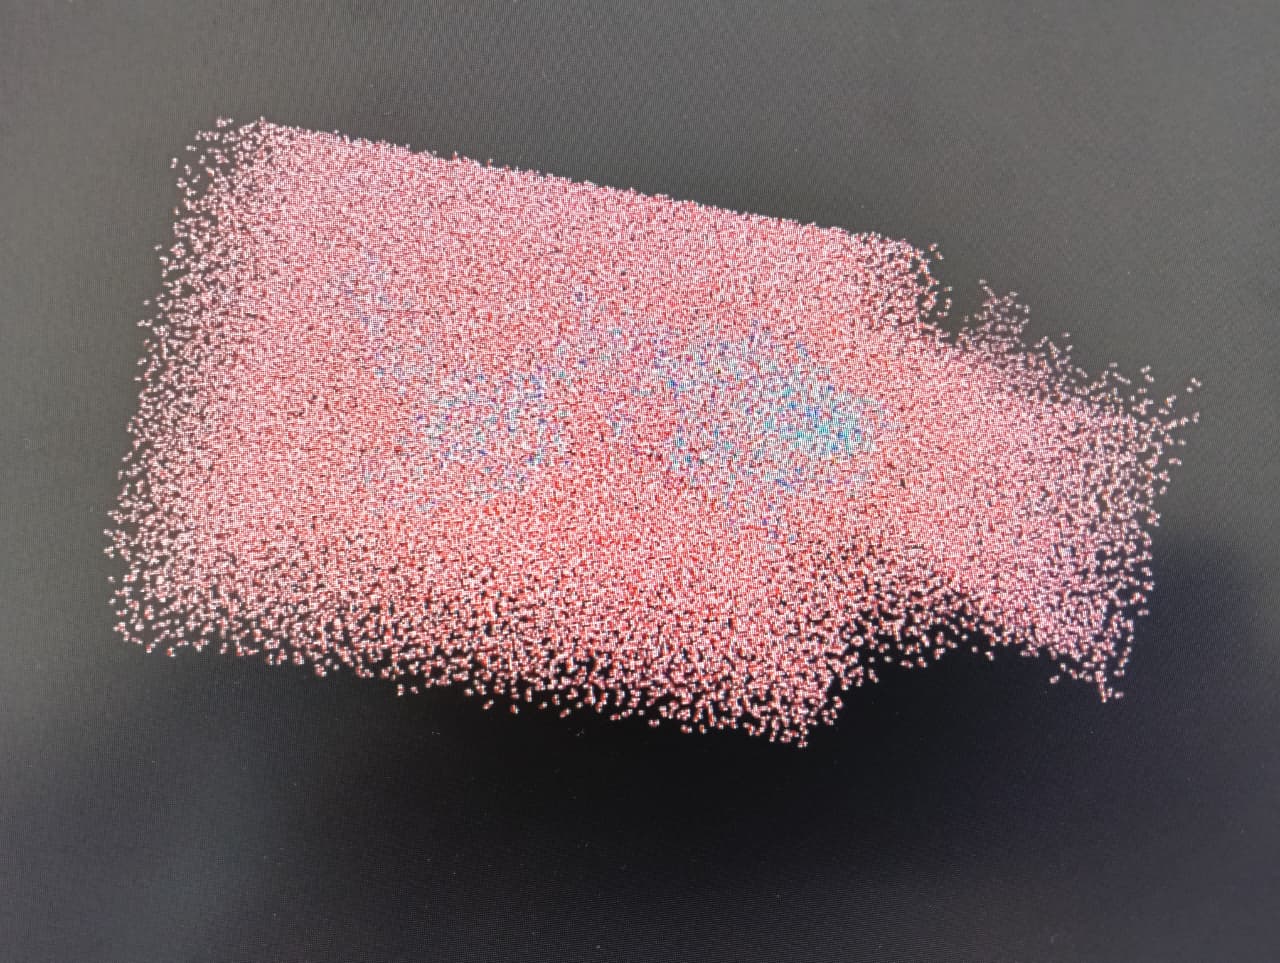
However, when I performed the production run under NPT (pmemd.cuda) and
analyzed the .rst7 file with cpptraj in the same way, the output structure
looks normal (screenshot attached).
I am not sure why there is such a difference in visualization between the
equilibration and production structures. Could this be related to imaging,
wrapping, or my input parameters?
Below are my input files:
Equilibrate the system for 10ns
&cntrl
nstlim=5000000, dt=0.002, ntx=5, irest=1, ntpr=1500, ntwr=1500,
ntwx=50000, ntxo=2, ioutfm=1,
tempi=300.0, temp0=300.0, ntt=3, gamma_ln=1.0,
ntb=1, ntp=0, ig=-1,
cut=18,
ntc=2, ntf=2,
nrespa=1,
ntr=0
/
Constant pressure constant temperature production run for 10ns
&cntrl
nstlim=5000000, dt=0.002, ntx=5, irest=1, ntpr=1000, ntwr=1000,
ntwx=25000, gamma_ln=1.0,
temp0=300.0, ntt=3, tautp=2.0,
ntb=2, ntp=1,
cut=18,
ntc=2, ntf=2,
nrespa=1,
&end
Both equilibration and production were run using *pmemd.cuda.*
Could anyone please explain why the structures appear so different between
equilibration and production? Is this expected behavior due to
imaging/periodic boundary conditions, or am I missing something? If anyone
has encountered this before, I would really appreciate your advice.
Thank you in advance for your help.
With regards,
Yashika
_______________________________________________
AMBER mailing list
AMBER.ambermd.org
http://lists.ambermd.org/mailman/listinfo/amber
(image/jpeg attachment: production.jpeg)
(image/jpeg attachment: equilibration.jpeg)
