Date: Wed, 14 Apr 2021 01:26:04 +0000
Dear all,
I run SMD by using Amber 20. In my inputfile, I have set some parameters of SMD to tell Amber run SMD.(As shown below) Then, in the output file, this simulation can be run successfully. I can get a file called "dist_vs_t". There are four columns of data in this file, but there is no title. So I don't know what these four columns mean?
Input file:
Sample pulling input
&cntrl
irest=1,ntx=5,
nstlim=2000000,dt=0.002,
igb=0,cut=8.0,
temp0=300.0,
ntt=3,gamma_ln=5.0,ig=-1
ntc=2,ntf=2,
ntpr=500,ntwx=2000,ntwv=0,ntwe=0,ntwr=2000,ntxo=1,iwrap=1,
ntp=1,ntb=2,pres0=1.0,taup=1.0,
ipol=0,tol=0.000001,
jar=1,
/
&wt type='DUMPFREQ', istep1=1000, /
&wt type='END', /
DISANG=dist.RST
DUMPAVE=dist_vs_t
LISTIN=POUT
LISTOUT=POUT
&end
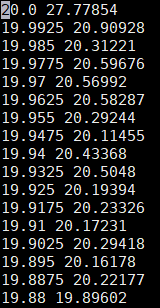
part of "dist_vs_t" file:
20.00000 27.77854 -155.57088 0.00000
19.99250 20.90928 -18.33554 0.20942
19.98500 20.31221 -6.54418 0.33826
19.97750 20.59676 -12.38525 0.42623
19.97000 20.56992 -11.99845 0.51276
19.96250 20.58287 -12.40731 0.60586
19.95500 20.29244 -6.74885 0.67079
19.94750 20.11455 -3.34104 0.72849
19.94000 20.43368 -9.87369 0.77824
19.93250 20.50480 -11.44597 0.83712
19.92500 20.19394 -5.37885 0.88489
19.91750 20.23326 -6.31521 0.93860
19.91000 20.17231 -5.24618 0.99481
19.90250 20.29418 -7.83359 1.05912
19.89500 20.16178 -5.33550 1.12539
19.88750 20.22177 -6.68550 1.18156
19.88000 19.89602 -0.32037 1.20717
19.87250 19.86138 0.22239 1.23157
19.86500 19.89926 -0.68510 1.26951
19.85750 19.86857 -0.22145 1.28906
19.85000 20.13551 -5.71029 1.30536
19.84250 19.92319 -1.61371 1.31613
19.83500 20.04631 -4.22625 1.33696
19.82750 20.12122 -5.87431 1.36713
19.82000 20.19494 -7.49889 1.39766
19.81250 20.15444 -6.83887 1.43710
19.80500 20.14334 -6.76681 1.45405
19.79750 19.86496 -1.34912 1.48940
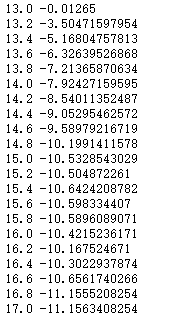
I analyzed the resulting data according to the tuition of T. Dwight McGee Jr. et al. I can get results similar to his. (the white is belong to T. Dwight McGee Jr; and black is mine) However, I still don't know what the second column of data represents in this document.
I want to ask the meaning of each column of data in these output files. And how can I do it in order to correctly analyze the results of SMD.
[cid:95bdfeb8-8a05-4efb-a9da-92b55fd69c3a] [cid:ed5031ad-61c2-4e72-89e1-4aab66716bda]
Thanks,
Xiaodong
_______________________________________________
AMBER mailing list
AMBER.ambermd.org
http://lists.ambermd.org/mailman/listinfo/amber
(image/png attachment: Outlook-schq1npt.png)
(image/png attachment: Outlook-h1h1ohz0.png)
