Date: Tue, 5 Feb 2019 11:07:17 +0000
Sorry I missed a file in previous email and plot of the PMF is attached
here.
On Tue, Feb 5, 2019 at 11:05 AM mish <smncbr.gmail.com> wrote:
> Dear all,
>
> This problem is not directly related to Amber but I am writing here just
> in case any amber user have experienced similar issue in wham analysis on
> amber data.
>
> I am doing umbrella sampling calculating on two small molecules where I am
> pulling them away from 2.5A to 20A with a gap of 1A between each window.
> The reaction coordinate is the distance between two atoms, e.g.
> ------------dist_04.00---------------
> &rst
> iat=4,37
> r1=2, r2=20.00, r3=20.00, r4=21,
> rk2=4.0, rk3=4.0,
> &end
> ------------md_04.00.in--------------
> 2ns NPT production for angstrom
> &cntrl
> imin = 0, ntx = 5, irest = 1,
> ntpr = 10000, ntwr = 20000, ntwx = 20000,
> ntf = 2, ntc = 2, cut = 10.0,
> ntb = 2, nstlim = 1000000, dt = 0.002,
> temp0 = 300, ntt = 3,
> gamma_ln = 1.0,
> ntp = 1, pres0 = 1.0, taup = 5.0,
> nmropt = 1, ioutfm=1, iwrap=1
> &end
> &wt
> type='DUMPFREQ', istep1=100,
> &end
> &wt
> type='END',
> &end
> DISANG=dist_04.00
> DUMPAVE=dist_04.00.dat
> ---------------------------------------------------
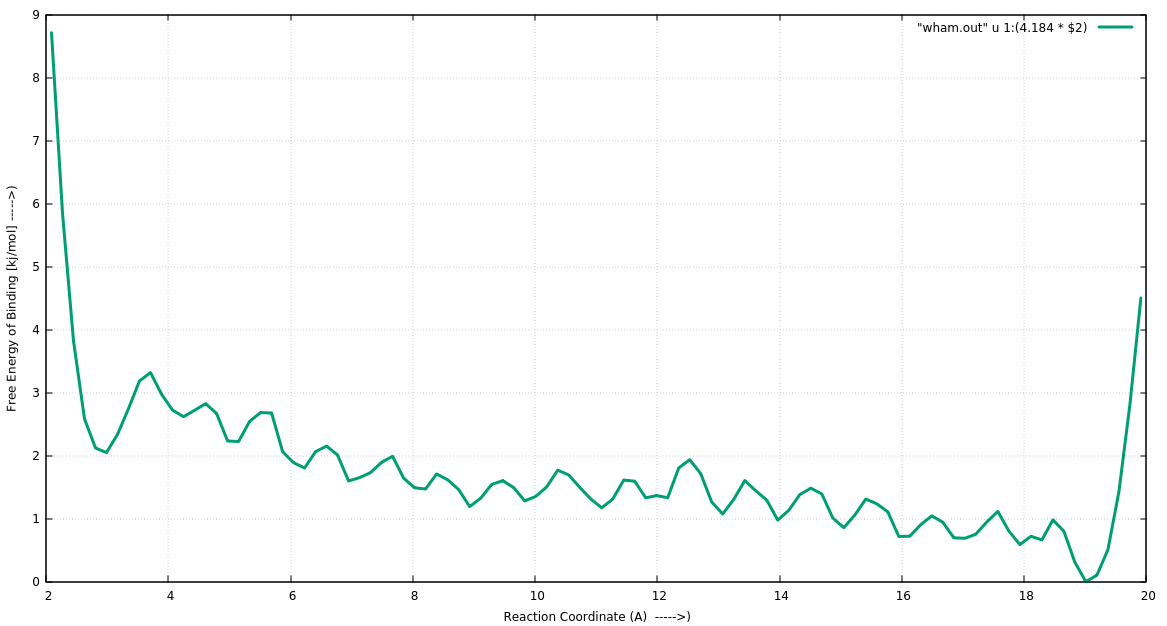
> I get nice overlapping histograms (see attached histogra.png) of the
> distances dumped by Amber18 (used pmemd.cuda). However, the PMF calculated
> by program wham looks really strange (see attached PMF.png).
>
> I used following command to calculate PMF:
>
> $wham 2 21 100 0.000000001 300 0 wham.in wham.out 10 9999
>
> wham input file looks like:
> win-02.50/dist_02.50.dat 2.50 1.00
> win-03.00/dist_03.00.dat 3.00 1.00
> win-04.00/dist_04.00.dat 4.00 1.00
> win-05.00/dist_05.00.dat 5.00 1.00
> win-06.00/dist_06.00.dat 6.00 1.00
> win-07.00/dist_07.00.dat 7.00 1.00
> win-08.00/dist_08.00.dat 8.00 1.00
> win-09.00/dist_09.00.dat 9.00 1.00
> win-10.00/dist_10.00.dat 10.00 1.00
> win-11.00/dist_11.00.dat 11.00 1.00
> win-12.00/dist_12.00.dat 12.00 1.00
> win-13.00/dist_13.00.dat 13.00 1.00
> win-14.00/dist_14.00.dat 14.00 1.00
> win-15.00/dist_15.00.dat 15.00 1.00
> win-16.00/dist_16.00.dat 16.00 1.00
> win-17.00/dist_17.00.dat 17.00 1.00
> win-18.00/dist_18.00.dat 18.00 1.00
> win-19.00/dist_19.00.dat 19.00 1.00
>
> I played with the tolerance and a lower tolerance seems to result into
> convergence. Its strange the PMF gets lower when distance is increasing and
> suddenly high at the end. Looks like a behavior for periodic collective
> variable despite no using "P" in wham analysis. Can someone point out the
> possible cause?
>
> Additionally, I noticed that if I keep iwarap=0 printed distance between
> selected atoms are sometimes way high than restrained distance. But if I
> image the trajectory and check the distance the values are within the range
> it is restrained. It seems like an issue with the PBC and one should always
> keep wrapping on while running such simulations?.
>
>
> Thanks,
> Mish
>
>
_______________________________________________
AMBER mailing list
AMBER.ambermd.org
http://lists.ambermd.org/mailman/listinfo/amber
(image/png attachment: PMF.png)
