Date: Tue, 5 Feb 2019 11:05:32 +0000
Dear all,
This problem is not directly related to Amber but I am writing here just in
case any amber user have experienced similar issue in wham analysis on
amber data.
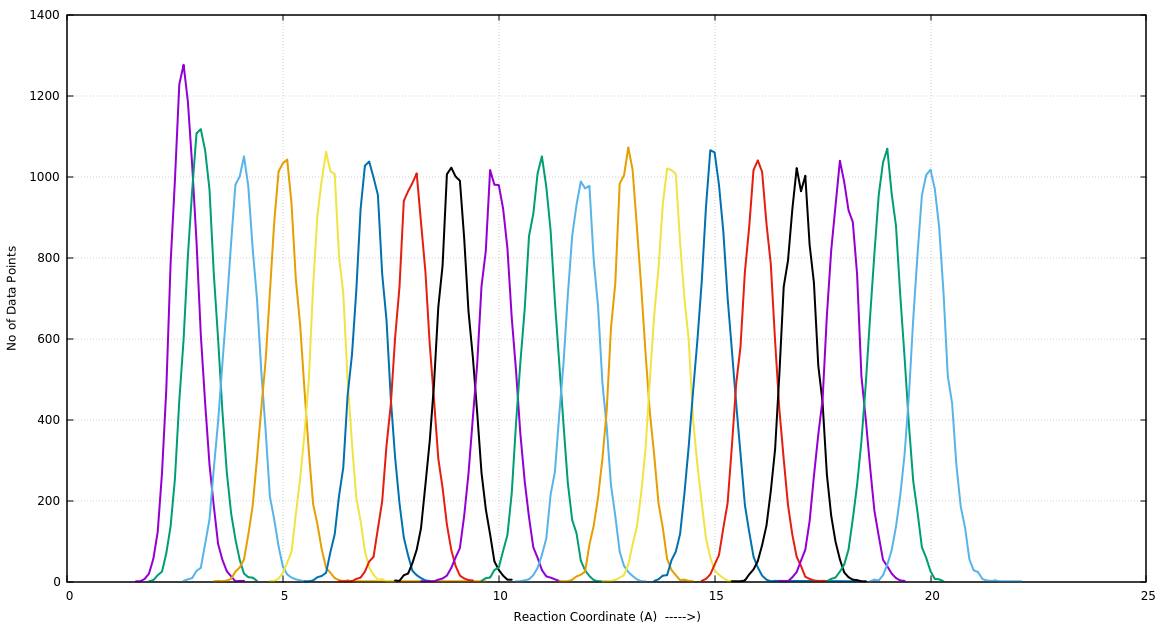
I am doing umbrella sampling calculating on two small molecules where I am
pulling them away from 2.5A to 20A with a gap of 1A between each window.
The reaction coordinate is the distance between two atoms, e.g.
------------dist_04.00---------------
&rst
iat=4,37
r1=2, r2=20.00, r3=20.00, r4=21,
rk2=4.0, rk3=4.0,
&end
------------md_04.00.in--------------
2ns NPT production for angstrom
&cntrl
imin = 0, ntx = 5, irest = 1,
ntpr = 10000, ntwr = 20000, ntwx = 20000,
ntf = 2, ntc = 2, cut = 10.0,
ntb = 2, nstlim = 1000000, dt = 0.002,
temp0 = 300, ntt = 3,
gamma_ln = 1.0,
ntp = 1, pres0 = 1.0, taup = 5.0,
nmropt = 1, ioutfm=1, iwrap=1
&end
&wt
type='DUMPFREQ', istep1=100,
&end
&wt
type='END',
&end
DISANG=dist_04.00
DUMPAVE=dist_04.00.dat
---------------------------------------------------
I get nice overlapping histograms (see attached histogra.png) of the
distances dumped by Amber18 (used pmemd.cuda). However, the PMF calculated
by program wham looks really strange (see attached PMF.png).
I used following command to calculate PMF:
$wham 2 21 100 0.000000001 300 0 wham.in wham.out 10 9999
wham input file looks like:
win-02.50/dist_02.50.dat 2.50 1.00
win-03.00/dist_03.00.dat 3.00 1.00
win-04.00/dist_04.00.dat 4.00 1.00
win-05.00/dist_05.00.dat 5.00 1.00
win-06.00/dist_06.00.dat 6.00 1.00
win-07.00/dist_07.00.dat 7.00 1.00
win-08.00/dist_08.00.dat 8.00 1.00
win-09.00/dist_09.00.dat 9.00 1.00
win-10.00/dist_10.00.dat 10.00 1.00
win-11.00/dist_11.00.dat 11.00 1.00
win-12.00/dist_12.00.dat 12.00 1.00
win-13.00/dist_13.00.dat 13.00 1.00
win-14.00/dist_14.00.dat 14.00 1.00
win-15.00/dist_15.00.dat 15.00 1.00
win-16.00/dist_16.00.dat 16.00 1.00
win-17.00/dist_17.00.dat 17.00 1.00
win-18.00/dist_18.00.dat 18.00 1.00
win-19.00/dist_19.00.dat 19.00 1.00
I played with the tolerance and a lower tolerance seems to result into
convergence. Its strange the PMF gets lower when distance is increasing and
suddenly high at the end. Looks like a behavior for periodic collective
variable despite no using "P" in wham analysis. Can someone point out the
possible cause?
Additionally, I noticed that if I keep iwarap=0 printed distance between
selected atoms are sometimes way high than restrained distance. But if I
image the trajectory and check the distance the values are within the range
it is restrained. It seems like an issue with the PBC and one should always
keep wrapping on while running such simulations?.
Thanks,
Mish
_______________________________________________
AMBER mailing list
AMBER.ambermd.org
http://lists.ambermd.org/mailman/listinfo/amber
- application/octet-stream attachment: pmf.out
(image/png attachment: histogram.png)
