Date: Thu, 6 Apr 2017 16:01:19 -0300
Hi.
I've been doing umbrella sampling simulations of a molecule going across a
POPC bilayer and would like to ask a few questions. First let me describe
what I've done so far. I'll be discussing about only one of the molecules
I've worked on, since all others follow the exact same protocol.
First I generated a lipid bilayer using CHARMM gui. Then I inserted the
molecule in substitution from a couple of water molecules. Then I ran
minimization, heating, equilibration using the the amber lipid tutorial as
a guideline. After that, I ran 250 ns of equilibration. My membrane is
composed of 120 POPC molecules. The crossing molecule is the
5-methyl-2,4-dinitrophenol. When I started this work, I found this tutorial
online :
https://github.com/callumjd/AMBER-Umbrella_COM_restraint_tutorial/blob/master/README.md
Which was very useful. I would like to take this opportunity to thank
Callum Dickson for the tutorial and discussion within. Ok, so, moving on.
The tutorial also listed 2 very interesting papers.
http://pubs.acs.org/doi/abs/10.1021/ct2009208 and
http://pubs.acs.org/doi/abs/10.1021/ct200316w
And so, I decided to extract the umbrella windows from the 250ns
simulation, and not from a pulling simulation, as was my plan earlier.
I extracted 150 z position frames, according to the distance between the
COM of the molecule and the COM of the POPC nitrogens. These ranged from
-35 to +35 angstrom. I then set the 150 distance restrain files spacing
them equally using numpy.linspace. You might be wondering why I chose 150
and not 140. Well, you see, there was some slight miscalculation regarding
the size of the simulation box. The original idea was to use 0.5 angstrom
spacing and the original box (from charmm gui) would give me a range from
roughly -37.5 to +37.5.....so...continuing...
I ran about 30 ns of equilibration with a z-position restrain for each
window (some windows required more time and some required less). After that
I ran 15 ns of production run (using the same z-restrain). Then I checked
if the distance distribution histograms overlayed (nice overlay, indeed). I
spaced the distout file samples every 10 md steps. I discarded the first 5
ns and performed wham on the last 10 ns using positions from z axis only.
I used different block sizes (within the 10ns production window) in order
to check for convergence, using the final PMF as the convergence parameter.
I am not sure that this is the best convergence criteria, but I was able to
see that windows larger than 3 ns had an average PMF that differed very
little (less than 0.01 for some z-points). This was a bit time consuming,
but it enabled me to have some idea about the accuracy of the final PMF.
Ok, now it comes to what I really wanted to discuss. Within the tutorial,
there are a few scripts that enabled me to calculate the diffusion and
permeability coefficient of the molecule.
The problem is that the final value I get for the permeability coefficient
is a bit large (for my taste, at least). And I was wondering If I did
anything wrong. I get as final results,
Reff: 0.0620777958588 Peff: 16.1088193639 cm/s
If you like, I can gladly share any data you need.
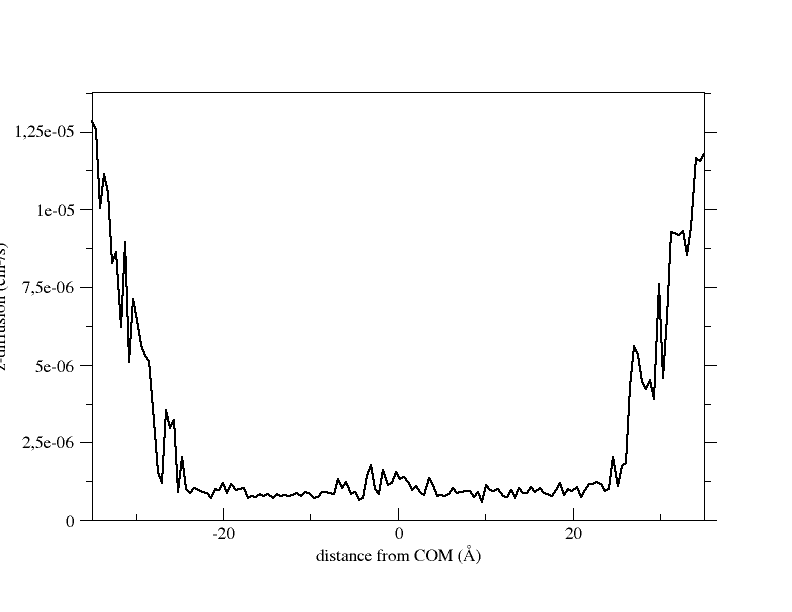
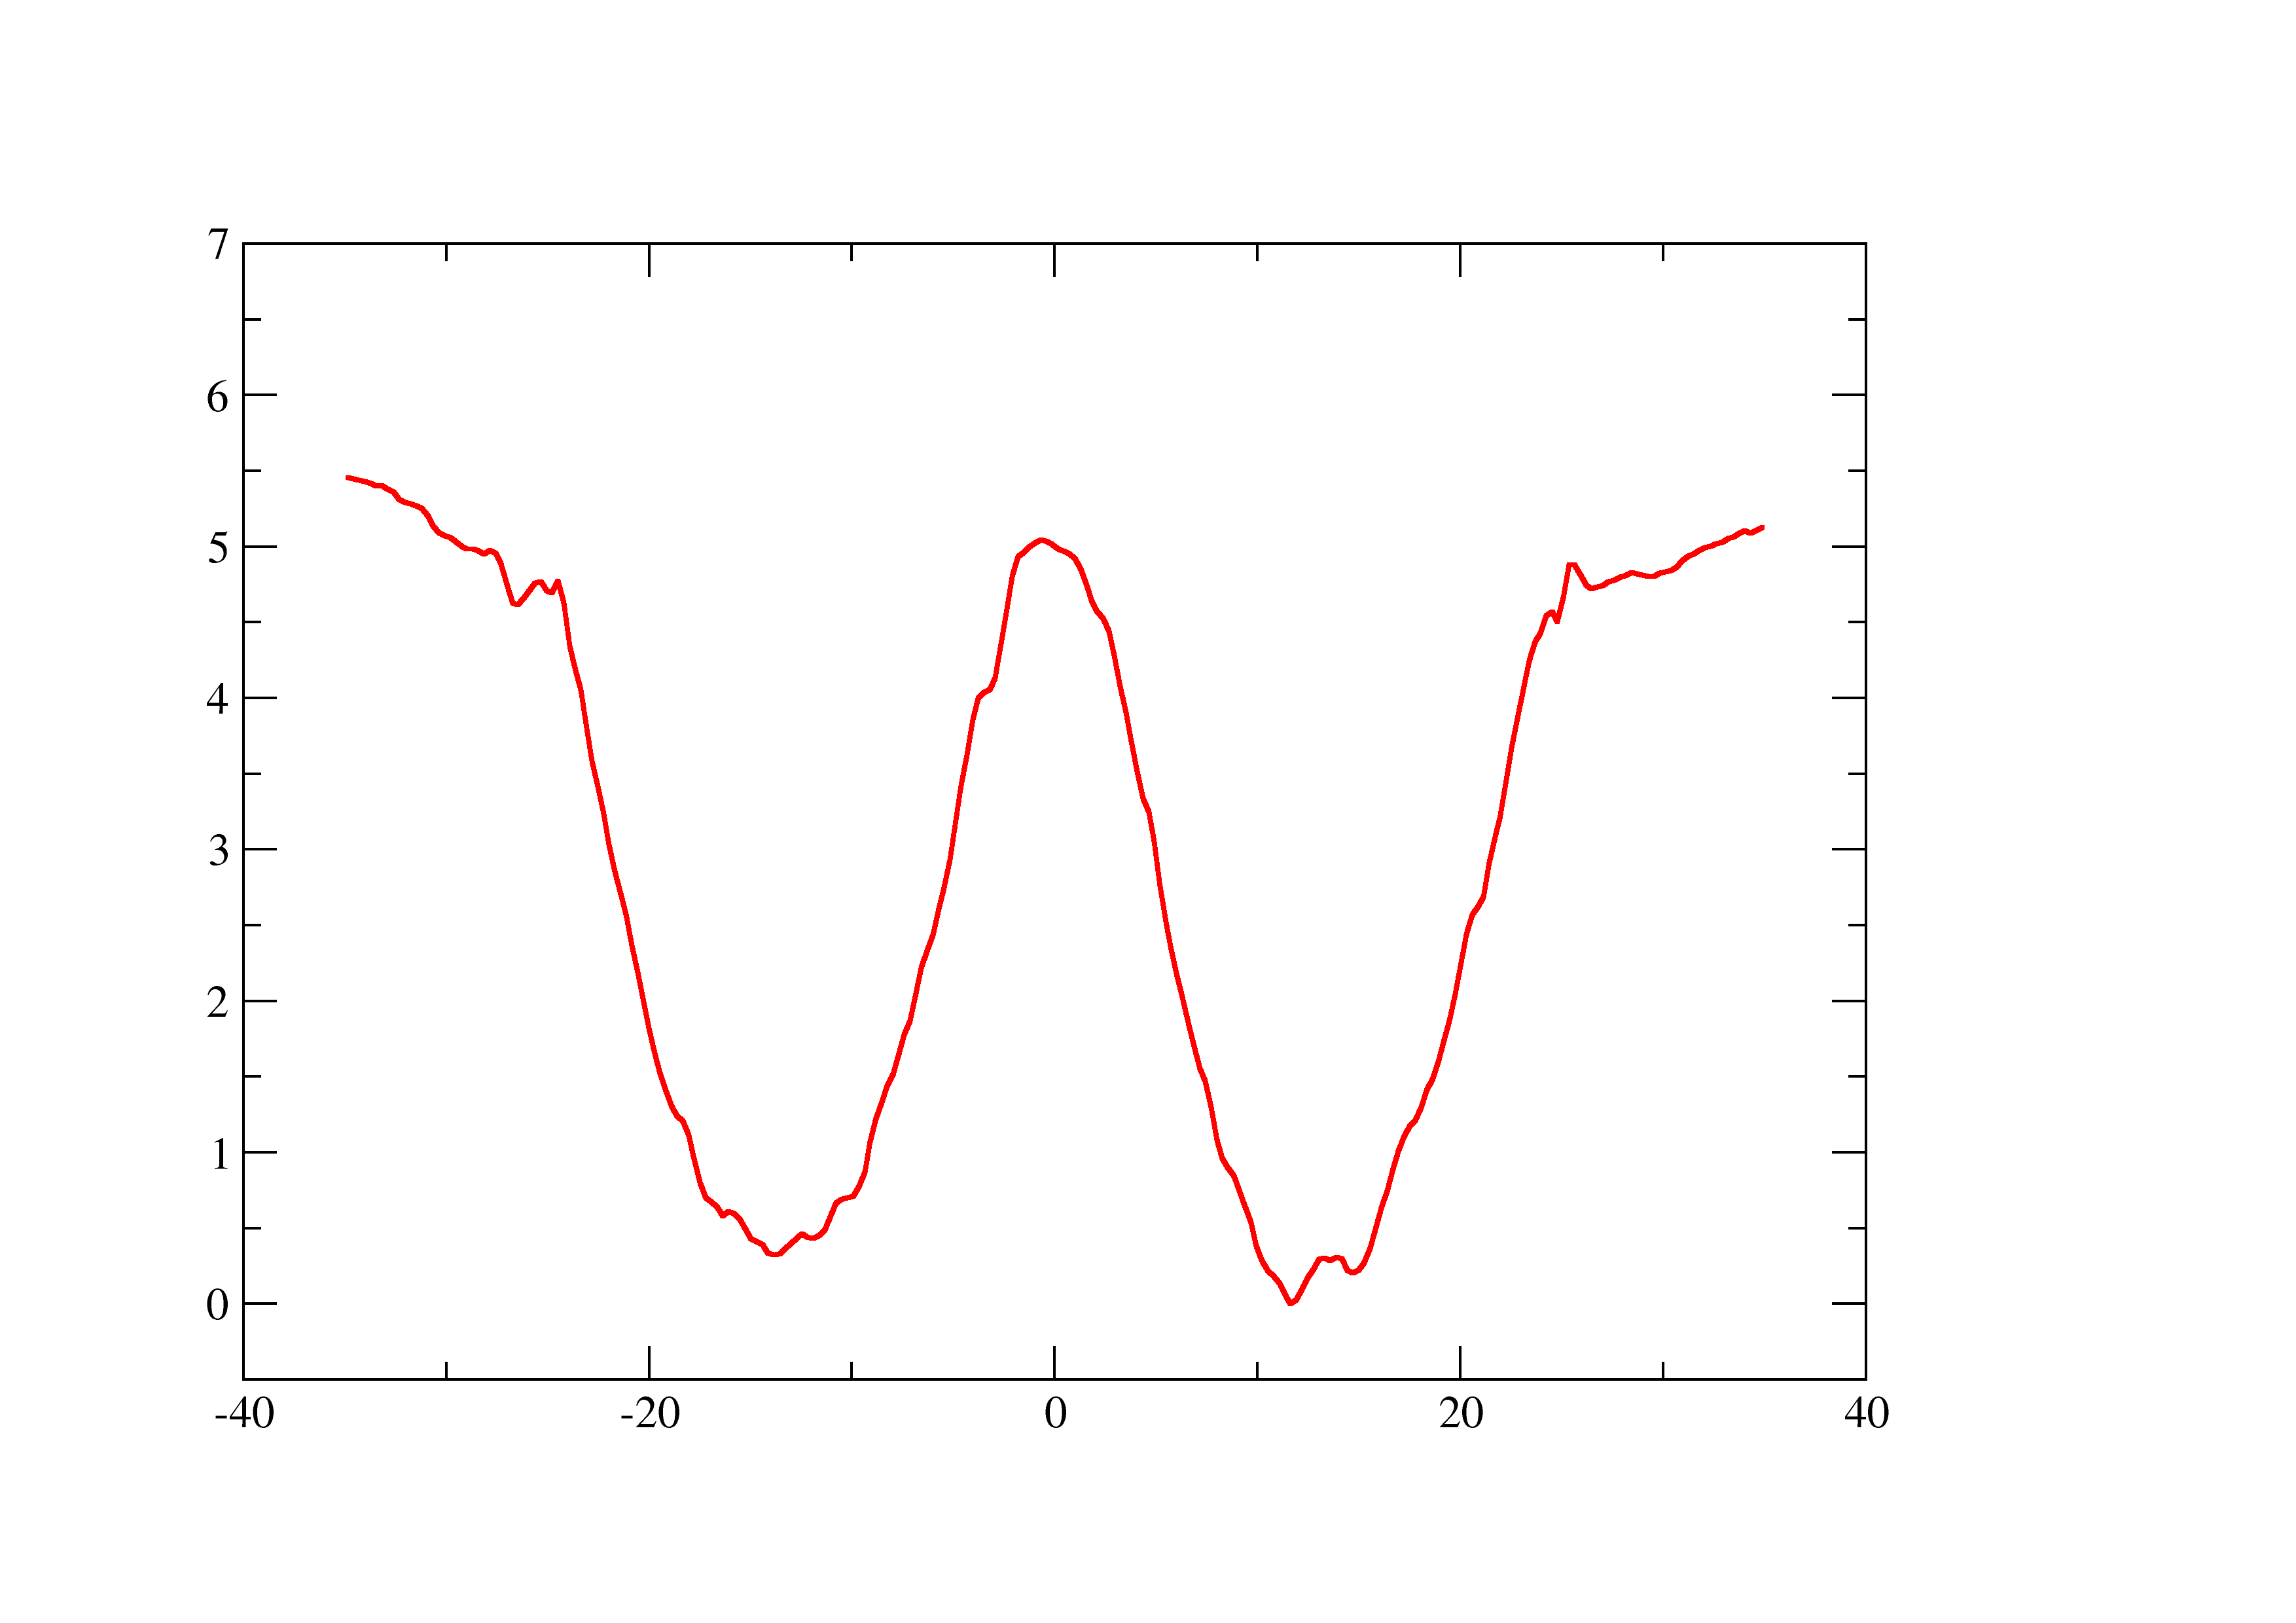
I'm not sure if I can attach graphs here, I'll try anyway. The first one
should be the diffusion coef values in cm^2/s. The second should be the
PMF. Note that it is not perfectly symmetrical because I used the entire
z-coordinate across the membrane in order to calculate it. I thought about
averaging the two halves and mirroring it, like Callum did in the tutorial,
but though about asking someone first.
Thank you
Fabrício Bracht
_______________________________________________
AMBER mailing list
AMBER.ambermd.org
http://lists.ambermd.org/mailman/listinfo/amber
(image/png attachment: diffusion1.png)
(image/png attachment: free.png)
