Date: Fri, 8 Jul 2016 12:58:19 +0000 (UTC)
Dear Vlad,
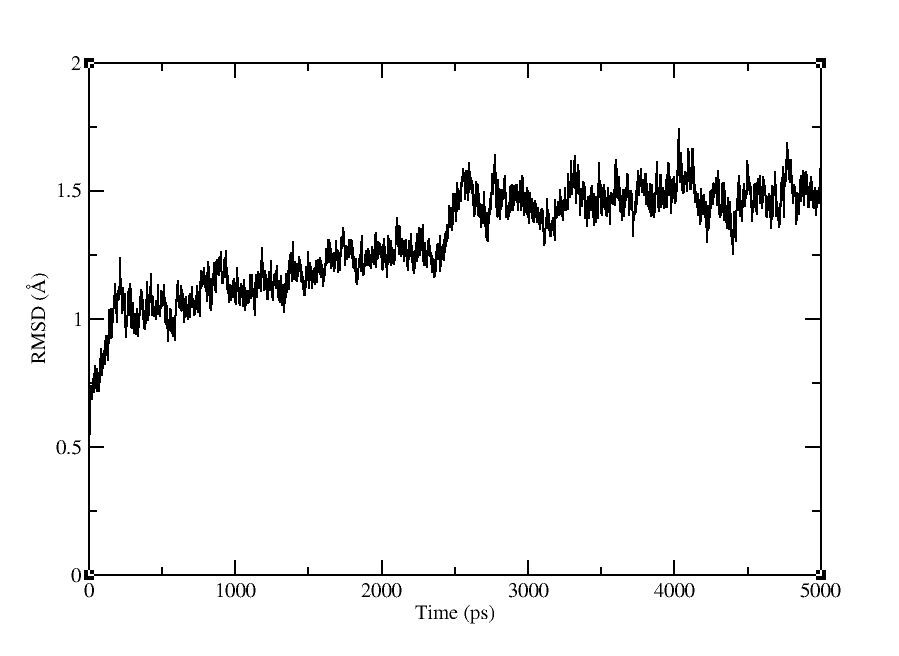
I have stripped affected frame. Now rmsd plot looks fine to me. I have attached it below. Some part of Rmsd file output is also pasted below. You can see that just frame 20 is affected. Can I skip this frame?
#Frame RMSD_00000
1 0.0000
2 0.4813
3 0.5477
4 0.5479
5 0.5466
6 0.5554
7 0.5986
8 0.6139
9 0.6185
10 0.6465
11 0.7406
12 0.7192
13 0.7219
14 0.7102
15 0.7047
16 0.7385
17 0.7029
18 0.7287
19 0.6984
20 22.4429
21 0.6824
22 0.7099
23 0.7363
24 0.7176
25 0.7423
26 0.7416
27 0.7454
28 0.7704
29 0.7403
30 0.7612
Best Regards, Sarah
On Friday, July 8, 2016 5:47 AM, Vlad Cojocaru <vlad.cojocaru.mpi-muenster.mpg.de> wrote:
OK, sorry but you mentioned a jump to 20 Angstr whereas your plot shows just 2 on the y axis. So I assumed you plot in nm .... If its a jump to 20 Angstr and you don't see it in the plot because you don't show the full scale, its a typical imaging issue ... Did you visualize your trajectory and go to the frame(s) that's causing problems ? How does it look like ?? How many frames are affected ?
Best
Vlad
On 07/08/2016 02:28 PM, Saman Yousuf ali wrote:
Dear vlad,
Thank you for your help. My rmsd y-axis is in angstrom. I have run backbone atoms rmsd. Script is pasted below.
trajin md_simulation_tac-comb.nc
rms first :1-526.CA,C,N out rmsd-tac.dat
atomicfluct out rmsf-tac.dat :1-526.CA,C,N byres
strip :WAT
strip :Cl-
Best Regards, Saman Yousuf Ali Junior Research Fellow,
| Lab No. P-133, Computational Chemistry Laboratory
Dr. Panjwani Center for Molecular Medicine & Drug Research,
International Center for Chemical & Biological Sciences,
University of Karachi – 75270. Karachi-Pakistan.
Contact No:
Office (92-21) 111222292 (Ext 309)
Email ID: saman.yousufali64.yahoo.com
saman.ali.iccs.edu
|
On Friday, July 8, 2016 5:17 AM, Vlad Cojocaru <vlad.cojocaru.mpi-muenster.mpg.de> wrote:
This looks to me like an imaging issue with that frame (or those few frames) .... check the frame(s), you should be able to see in a visualization software what happens. If it is an imaging issue, simply remove it (them) from the processed trajectory.... If for some reason you really need exactly those frames affected, try some manual imaging procedures ... or re-run the simulation (5 ns should be doable)
Just a remark ... if your y axis is nm, the rmsd looks to quite large during the entire simulation.... How did you calculate the RMSD ? What parts of the system did you fit ? Is this RMSD for the fitted parts or for other parts ?
Best
Vlad
On 07/08/2016 01:42 PM, Saman Yousuf ali wrote:
Dear zoran,
This rmsd plot is generated after 5ns production run. I have performed protein ligand complex md simulation. When I reimaged my mdcrd after production it gives me following error for 1ns trajectory; Warning: autoimage: Frame 20 imaging failed, box lengths are zero. While rest of proceed normally without this warning. you see in attached file that the rmsd jumps to near20 angstroms. This is a sign of something seriouslywrong with the trajectory.
Best Regards, Sarah
On Friday, July 8, 2016 4:17 AM, zoran matovic <zmatovic.kg.ac.rs> wrote:
Hi,
What kind of MD (heating, equil., production)? What kind of molecule is the
"complex"? What was the reference structure you have used for RMSD? What's
up to me you have nice equilibrium after 5 ns.
cheers
zoran
Dear all,
I have performed 5ns md simulation using amber14. Rmsd plot of one my
simulated complex shows unusua 20 angstrom fluctuation at starting ns. I am
unable to understand the reason. Rmsd plot is attached below. Kindly help
me. Best Regards, Sarah
_______________________________________________
AMBER mailing list
AMBER.ambermd.org
http://lists.ambermd.org/mailman/listinfo/amber
_______________________________________________AMBER mailing listAMBER.ambermd.orghttp://lists.ambermd.org/mailman/listinfo/amber
--
Dr. Vlad Cojocaru
Computational Structural Biology Laboratory
Department of Cell and Developmental Biology
Max Planck Institute for Molecular Biomedicine
Röntgenstrasse 20, 48149 Münster, Germany
Tel: +49-251-70365-324; Fax: +49-251-70365-399
Email: vlad.cojocaru[at]mpi-muenster.mpg.de
http://www.mpi-muenster.mpg.de/43241/cojocaru
_______________________________________________
AMBER mailing list
AMBER.ambermd.org
http://lists.ambermd.org/mailman/listinfo/amber
(image/png attachment: rmsd-strip.png)
