Date: Wed, 6 May 2015 10:47:01 -0600
Hi,
As far as this goes:
"I also did a quick literature search on DBSCAN use in MD analysis, and I
saw that in the following paper <
http://www.ncbi.nlm.nih.gov/pmc/articles/PMC3893832/> the minpoints is set
to be 25, but I can't find in the paper or its Supporting Information any
"K-dist" plot. Does this mean that the 0.9 value for epsilon was taken from
a Kdist.25 plot?"
The algorithm, minpoints value, epsilon value, and atoms used for
clustering were determined through trial and error for this system. We
revised all three metrics until we decided on a combination which showed
separation of conformations we know exist (the NMR major and minor
structure) vs. those we know that do NOT exist (the NMR major structure
with a rotated chi dihedral, so one base is flipped syn instead of anti,
for example). This took a lot of effort, but what we did NOT do was use a
K-dist plot to decide on our parameters. There is no K-dist plot in the
paper or supporting information because we did not generate one. I have
attached the kdist plot I generated just now using the following command to
this email:
cluster dbscan kdist 25 rms :1.N2,O6,C1',P,:2.H2,N6,C1',P,:3.O2
,H5,C1',P,:4.O2,H5,C1',P sieve 30
And we get the curve flattening at just less than 1.0, so our choice of
epsilon=0.9 is probably fine.
-Christina
On Wed, May 6, 2015 at 10:22 AM, Juan Eiros Zamora <
j.eiros-zamora14.imperial.ac.uk> wrote:
> Dear Amber users,
>
> I am trying to cluster several trajectories of the protein that I'm
> working with (419 residues)
>
> I have dumped together into one .nc file all of my simulations, and now I
> am trying to figure out how to correctly set up the parameters for a DBSCAN
> analysis of certain regions of the protein.
>
> I have generated different "K-dist" plots for values of K from 4 to 10
> (attached) using the following cpptraj commands:
>
> parm ./stripped.prmtop
> trajin ./runs.nc 1 last 10
> cluster dbscan kdist 4 rms :232-248 sieve 10 #Change the kdist value
> accordingly
> run
>
> From what I understand, now epsilon should be chosen as the Y value of the
> "K-dist" graph where the slope flattens out, and minpoints is the value of
> K?
> The dimensions of an MD data set is 3 (tridimensional space) so K should
> always be set to >= Dimensions + 1?
>
> From the Amber manual and the original DBSCAN paper, both suggest K to be
> 4 (although in the original paper they mention 4 should be for 2
> dimensional data); but from my graphs I see that changing the K value also
> makes the Epsilon value vary substantially (the bending point changes).
>
>
> I also did a quick literature search on DBSCAN use in MD analysis, and I
> saw that in the following paper <
> http://www.ncbi.nlm.nih.gov/pmc/articles/PMC3893832/> the minpoints is
> set to be 25, but I can't find in the paper or its Supporting Information
> any "K-dist" plot. Does this mean that the 0.9 value for epsilon was taken
> from a Kdist.25 plot?
>
> Any comments on this matter will be greatly appreciated.
>
>
> Best regards,
>
> Juan Eiros
>
>
>
> _______________________________________________
> AMBER mailing list
> AMBER.ambermd.org
> http://lists.ambermd.org/mailman/listinfo/amber
>
>
--
---------------------------------------------------------------------------------------
Christina Bergonzo, PhD
Postdoctoral Researcher
Department of Medicinal Chemistry, University of Utah
30 South 2000 East, Rm. 201
Salt Lake City, UT 84112-5820
Office: L.S. Skaggs Pharmacy Research Institute, Rm.4290
http://home.chpc.utah.edu/~cheatham/
(801) 587-9652 / Fax: (801) 585-6208
---------------------------------------------------------------------------------------
_______________________________________________
AMBER mailing list
AMBER.ambermd.org
http://lists.ambermd.org/mailman/listinfo/amber
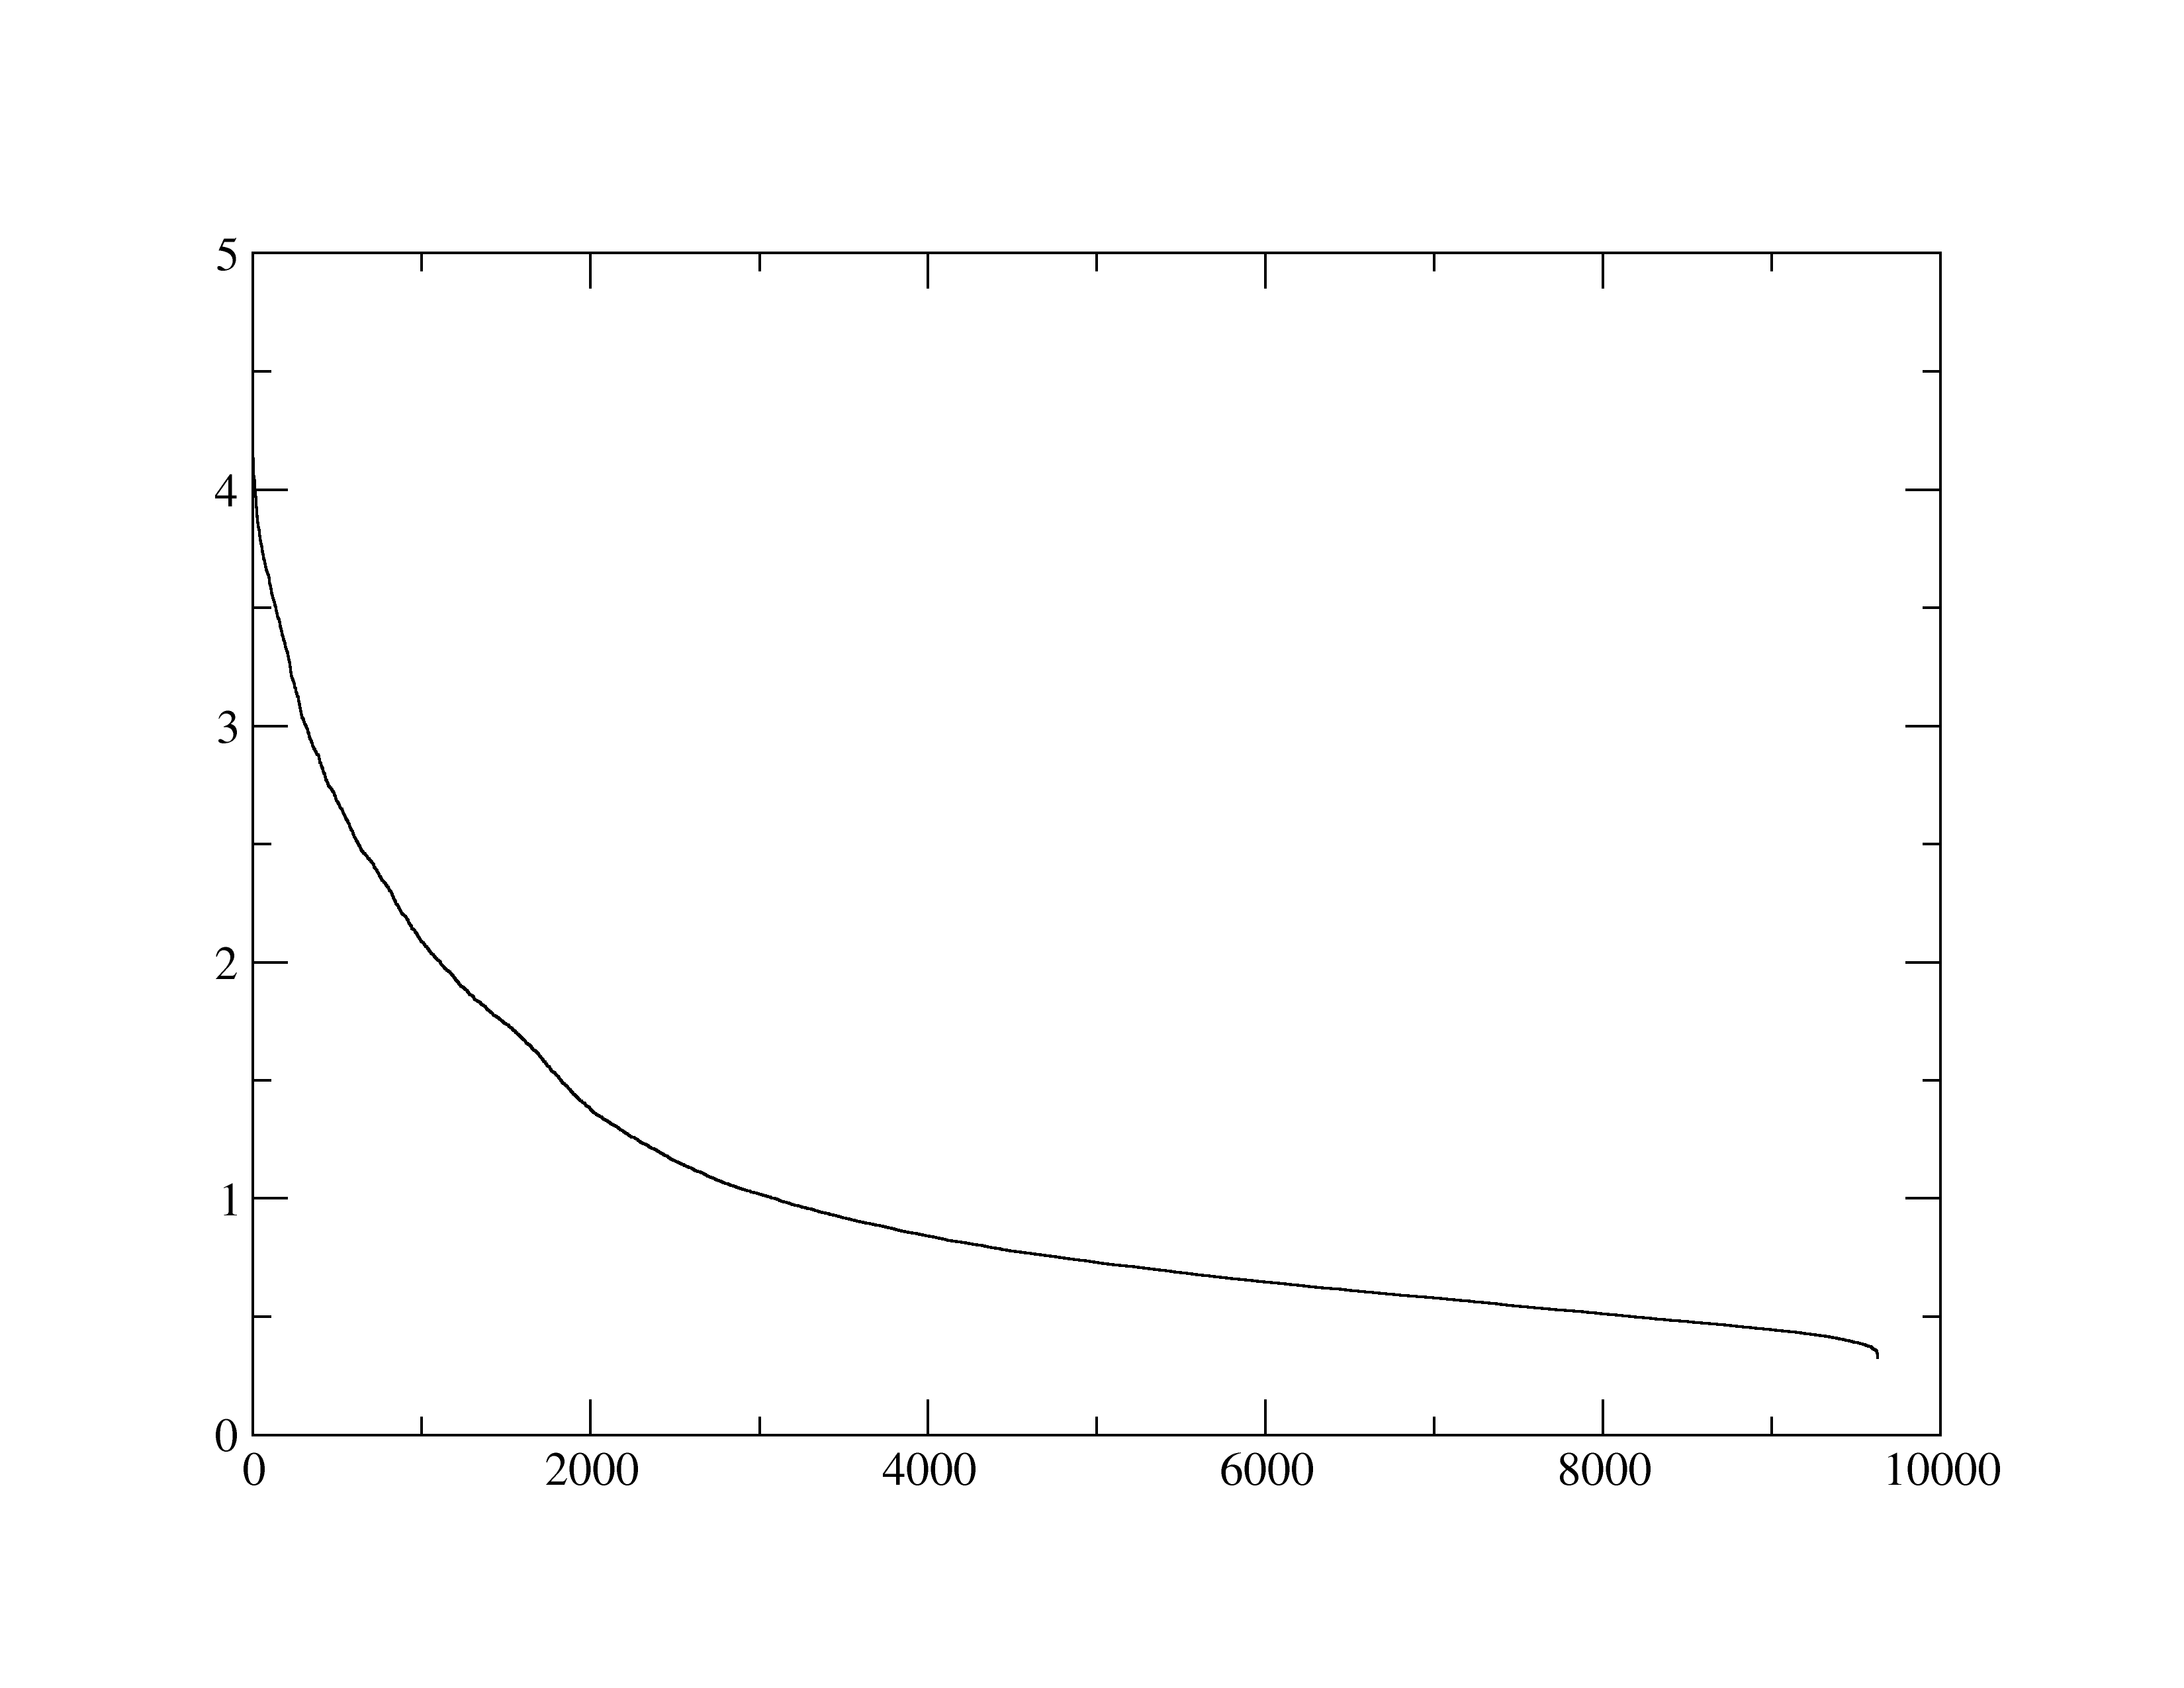
(image/png attachment: Kdist.25.png)
