Date: Wed, 06 May 2015 17:22:04 +0100
Dear Amber users,
I am trying to cluster several trajectories of the protein that I'm
working with (419 residues)
I have dumped together into one .nc file all of my simulations, and now
I am trying to figure out how to correctly set up the parameters for a
DBSCAN analysis of certain regions of the protein.
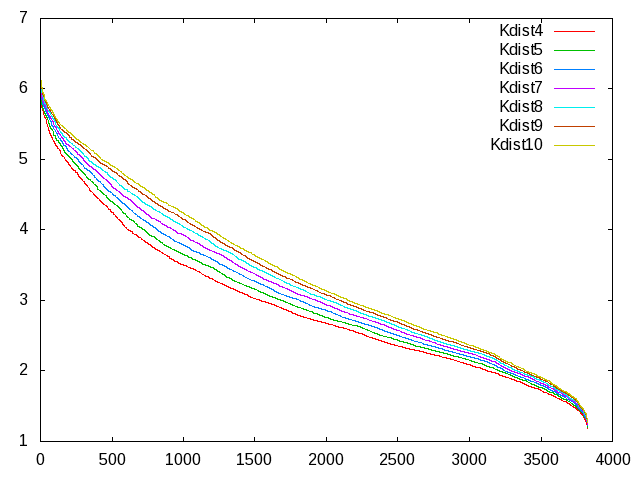
I have generated different "K-dist" plots for values of K from 4 to 10
(attached) using the following cpptraj commands:
parm ./stripped.prmtop
trajin ./runs.nc 1 last 10
cluster dbscan kdist 4 rms :232-248 sieve 10 #Change the kdist value
accordingly
run
From what I understand, now epsilon should be chosen as the Y value of
the "K-dist" graph where the slope flattens out, and minpoints is the
value of K?
The dimensions of an MD data set is 3 (tridimensional space) so K should
always be set to >= Dimensions + 1?
From the Amber manual and the original DBSCAN paper, both suggest K to
be 4 (although in the original paper they mention 4 should be for 2
dimensional data); but from my graphs I see that changing the K value
also makes the Epsilon value vary substantially (the bending point
changes).
I also did a quick literature search on DBSCAN use in MD analysis, and
I saw that in the following paper
<http://www.ncbi.nlm.nih.gov/pmc/articles/PMC3893832/> the minpoints is
set to be 25, but I can't find in the paper or its Supporting
Information any "K-dist" plot. Does this mean that the 0.9 value for
epsilon was taken from a Kdist.25 plot?
Any comments on this matter will be greatly appreciated.
Best regards,
Juan Eiros
_______________________________________________
AMBER mailing list
AMBER.ambermd.org
http://lists.ambermd.org/mailman/listinfo/amber
(image/png attachment: Kplots.png)
