Date: Fri, 11 Jul 2014 19:59:47 +0100
HI all,
Would someone please give a hint on what is the possible cause of my
strange energy plot during minimization. I attach the graphs in each 3
minimization tests. It seems that the protein did not successfully relaxed.
Could it be it due to amino acid clashes in the input file ? Or something
is not proper in my input scipt.
minim1.in
------------------------------------
Minimization with cartesian restraints on the solute
&cntrl
imin=1,
ntx=1,
ntpr=5, ntwx=0, ntwv=0, ntwe=0,
ntf=1, ntb=1,
cut=8.0, nsnb=25,
ntr=1,
maxcyc=1000, ntmin=1, ncyc=500,
/
restraint atom specification
100.0
RES 1 535
END
END
---------------------------------------
minim2.in
------------
minimization with cartesian restraints on the solvent
&cntrl
imin=1,
ntx=1,
ntpr=5, ntwx=0, ntwv=0, ntwe=0,
ntf=1, ntb=1,
cut=8.0, nsnb=25,
ntr=1,
maxcyc=1000, ntmin=1, ncyc=500,
/
restraint atom specification
100.0
RES 536 998
END
END
----------------
minim3.in
------------
minimization without restraint
&cntrl
imin=1,
ntx=1,
ntpr=5, ntwx=0, ntwv=0, ntwe=0,
ntf=1, ntb=1,
cut=8.0, nsnb=25,
ntr=0,
maxcyc=1000, ntmin=1, ncyc=500,
-----------------
Cheers
A
_______________________________________________
AMBER mailing list
AMBER.ambermd.org
http://lists.ambermd.org/mailman/listinfo/amber
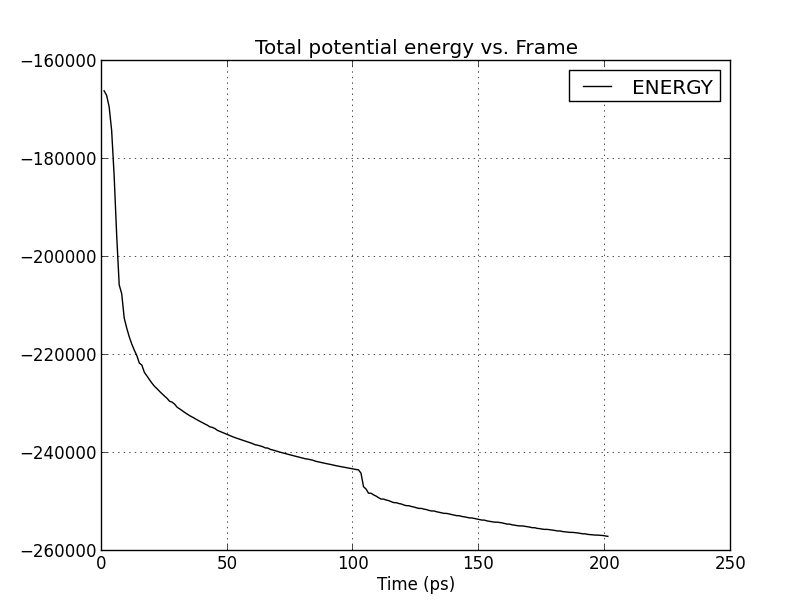
(image/png attachment: minim1_energy.png)
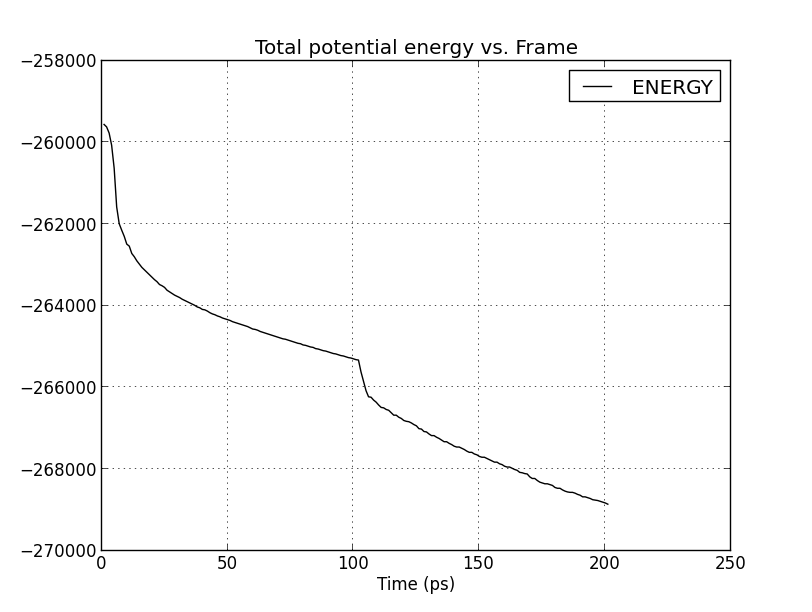
(image/png attachment: minim2_energy.png)
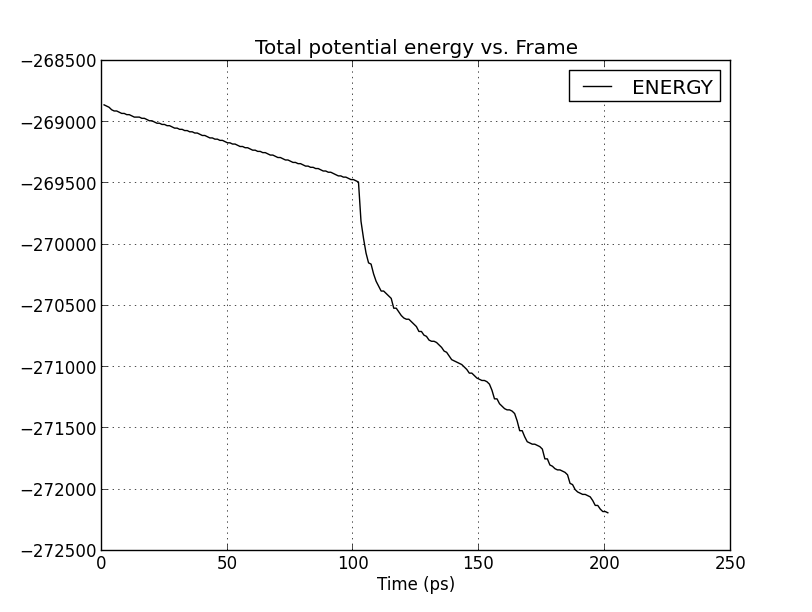
(image/png attachment: minim3_energy.png)
