Hi all,
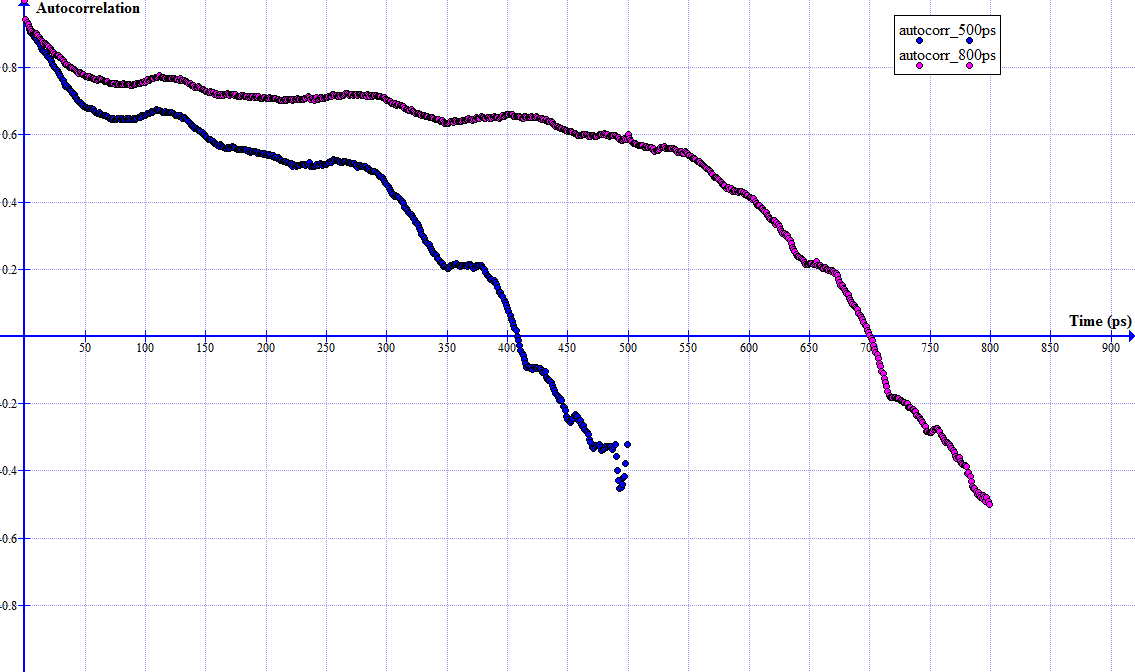
I ran a particular MD simulation for 500ps and got 500 snapshots in my
mdcrd. I calculated the time-autocorrelation for a position vector for that
500ps. Then I ran the same simulation for another 300ps (i.e.altogether
800ps) starting from the coordinates of the the restart file for the 500th
snapshot of the previous MD run. I calculated the time-autocorrelation for
the same position vector for the whole 800ps by giving both mdcrds (one for
500ps and the other for the 300ps) as input for ptraj. I have attached an
image which shows how these two plots look.
I have a couple of questions regarding the two plots.
1) What is the reason for the first 500ps of both plots for not being
identical? Is it because the normalizing factors for the two
auto-correlations being different?
2) Could anyone please tell me the equation they use in amber to calculate
the time-autocorrealtion functions?
Thank you very much
Sajeewa Dewage
_______________________________________________
AMBER mailing list
AMBER.ambermd.org
http://lists.ambermd.org/mailman/listinfo/amber
Received on Wed May 22 2013 - 14:00:02 PDT
