Date: Mon, 13 Jan 2025 15:52:54 -0800
Hello AMBER fellows,
I would like to ask or have opinions on how people usually report their ΔΔG
relative binding free energy vs experimental ΔG when they investigate free
energy calculation using FEP+ or TI calculations using AMBER.
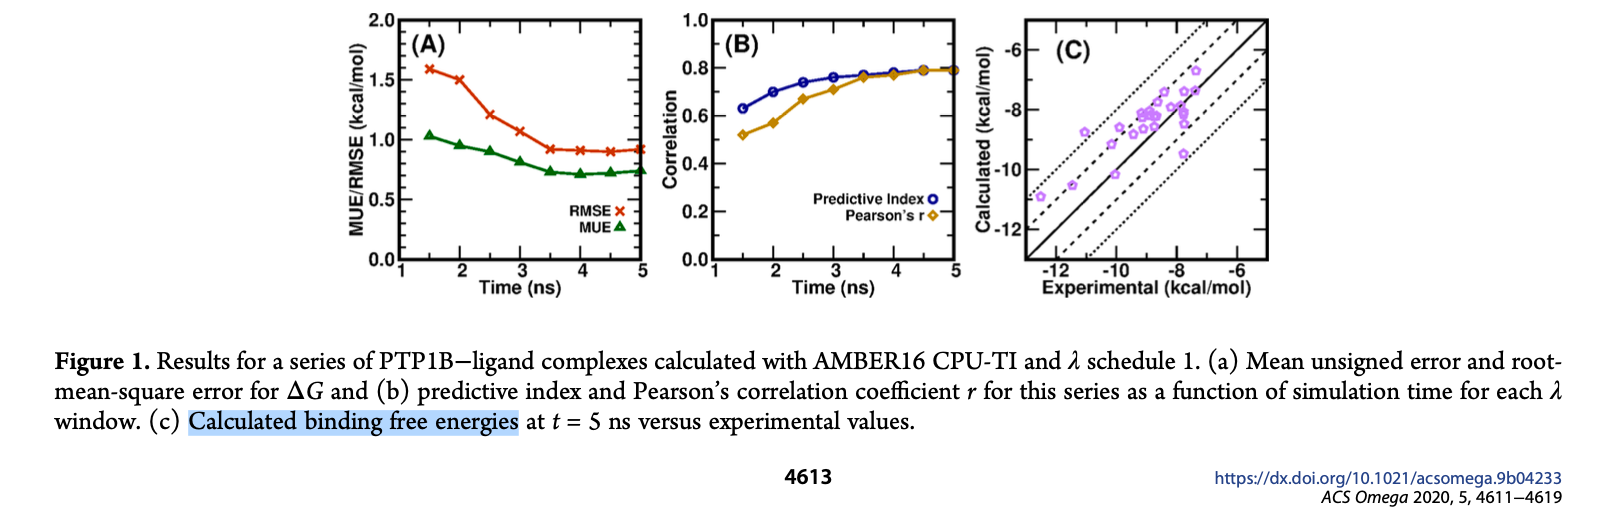
I have included some figures in the articles below, as people report the ΔG
(binding free energy for each ligand) in the Y-axis vs experimental ΔG in
the x-axis using TI, https://dx.doi.org/10.1021/acsomega.9b04233
[image: Screenshot 2025-01-13 at 1.26.30 PM.png]
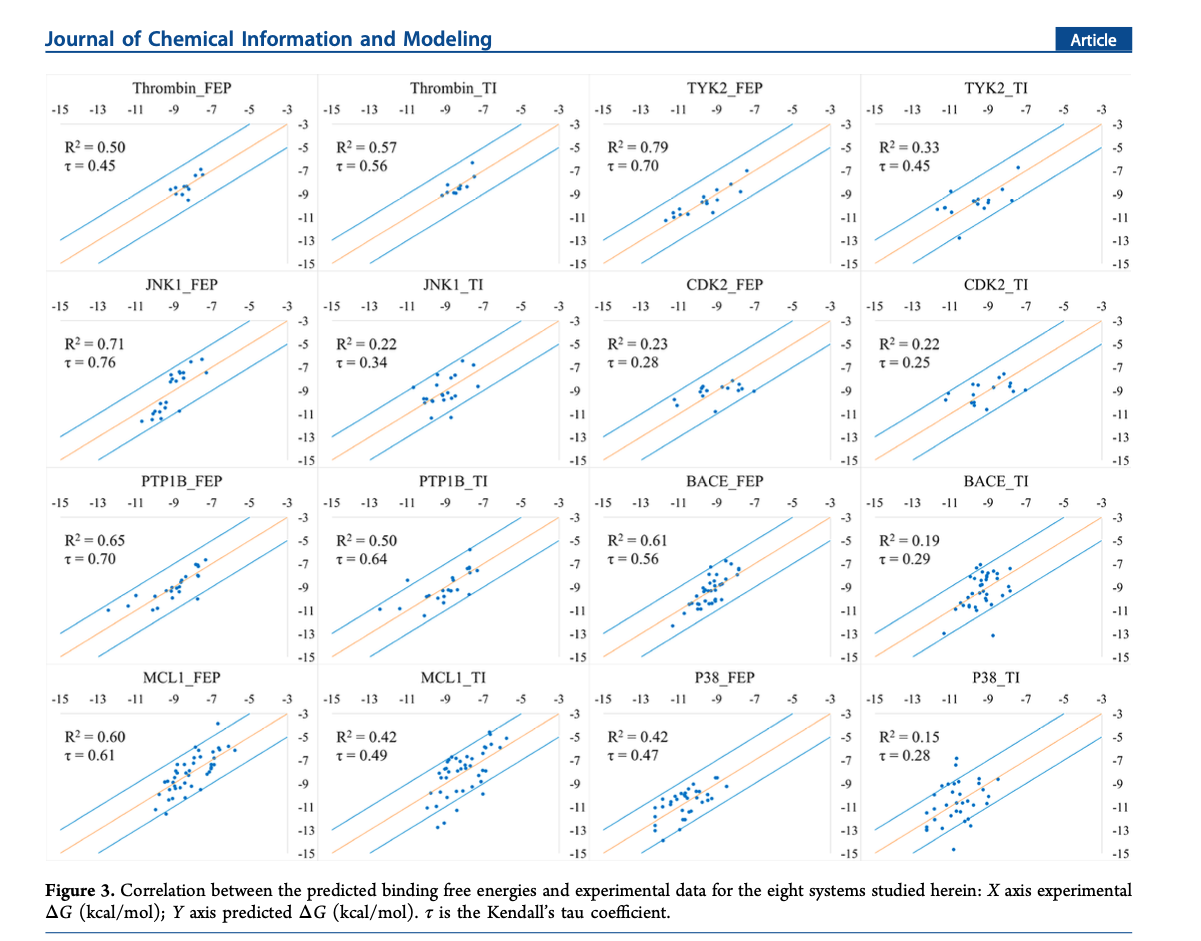
or below, DOI: 10.1021/acs.jcim.9b00105, using TI and FEP+
[image: Screenshot 2025-01-13 at 1.29.15 PM.png]
My understanding for reported experimental ΔGs were from the IC50, Kd, Ki,
and convert them to ΔG using -RTln(Kd), and this should be the binding
affinity for the corresponding ligand, whereas when we simulate/calculate
the relative binding free energy from ligand 1 to ligand2, there is not
absolute, but relative binding free energy ΔΔG?! Then, how should we report
in terms of graphing? ΔΔG in Y axis and experimental ΔG in X axis? I am not
sure about that?
_______________________________________________
AMBER mailing list
AMBER.ambermd.org
http://lists.ambermd.org/mailman/listinfo/amber
(image/png attachment: Screenshot_2025-01-13_at_1.26.30___PM.png)
(image/png attachment: Screenshot_2025-01-13_at_1.29.15___PM.png)
