Date: Wed, 16 Dec 2020 11:50:02 +0530
Hello,
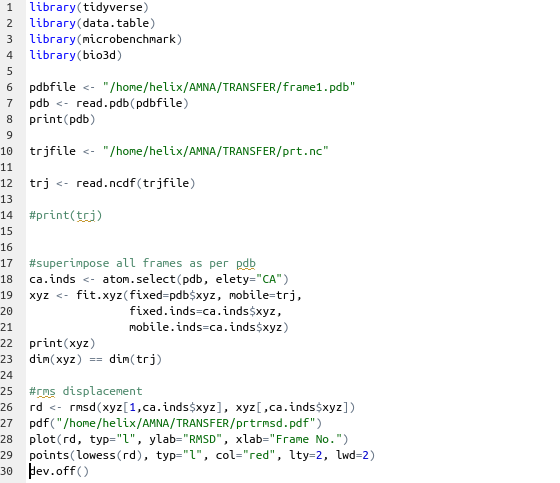
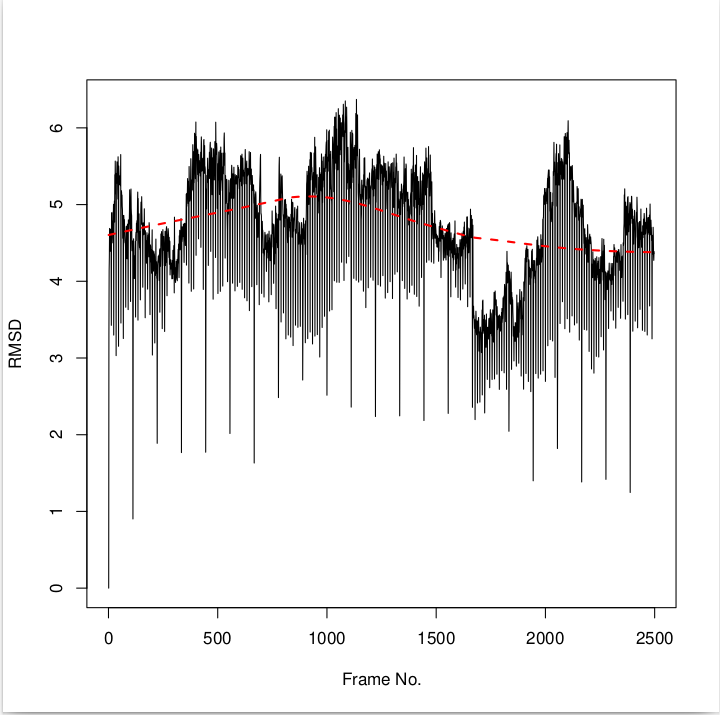
The .nc file of a protein DNA simulation of 500ns have 2500 frames when i
plot the rmsd of the same by R for the protein it shows sudden fall at the
equal intervals unlike rmsd plot for the only DNA doesn't show such
pattern. I am attaching the protein rmsd plot as well as the R script to
plot the graph.
[image: image.png]
[image: image.png]
--
Sincerely,
*Syeda Amna Arshi*
*Ph.D. Scholar*
Multidisciplinary Centre For Advanced Research and Studies
Jamia Millia Islamia
Delhi-110025
Ph.no: 7737638065
[image: Image result for save world by plant][image: Image result for save
world by plant white background]
_______________________________________________
AMBER mailing list
AMBER.ambermd.org
http://lists.ambermd.org/mailman/listinfo/amber
(image/png attachment: image.png)
(image/png attachment: 02-image.png)
