Date: Mon, 14 Dec 2020 14:46:06 +0530
Hello,
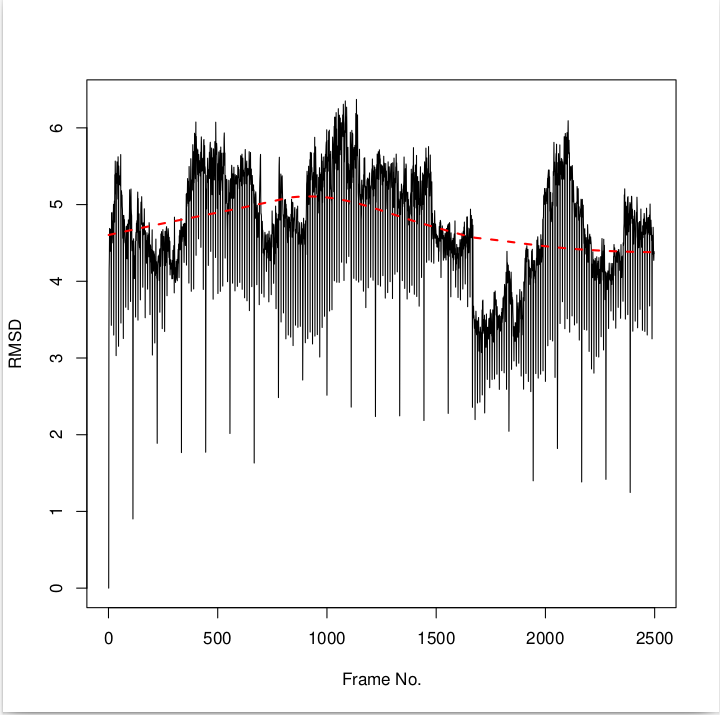
I am running simulation of a protein DNA complex, but the RMSD plot of the
same shows fall in the RMSD value at equal intervals ( the straight lines)
unlike only DNA that doesn't show such pattern of falling of values in
RMSD. I am attaching the script of md_200ps.in as well as the rmsd plot.
complex: 200ps of MD
&cntrl
imin = 0, irest = 1, ntx = 7,
ntb = 2, pres0 = 1.0, ntp = 1,
taup = 2.0,
cut = 10.0, ntr = 0, ig = -1,
ntc = 2, ntf = 2,
tempi = 300.0, temp0 = 300.0,
ntt = 3, gamma_ln = 1.0,
nstlim = 100000, dt = 0.002,
ntpr = 100000, ntwx = 1000, ntwr = 100000
/
Sincerely,
*Manisha*
*Ph.D. Scholar*
Multidisciplinary Centre For Advanced Research and Studies
Jamia Millia Islamia
Delhi-110025
Ph.no: 9518014737
[image: Image result for save world by plant][image: Image result for save
world by plant white background]
_______________________________________________
AMBER mailing list
AMBER.ambermd.org
http://lists.ambermd.org/mailman/listinfo/amber
(image/png attachment: image.png)
