Date: Thu, 17 Aug 2017 22:22:45 -0400
Hi, Feng,
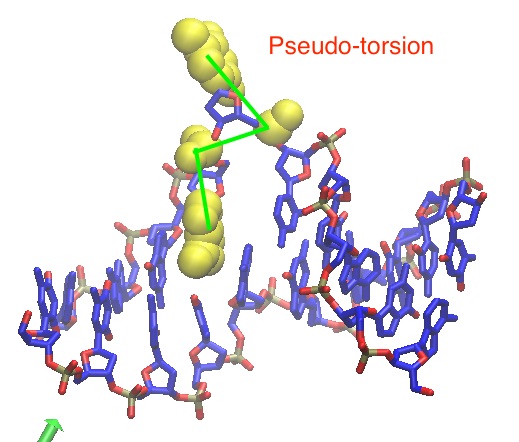
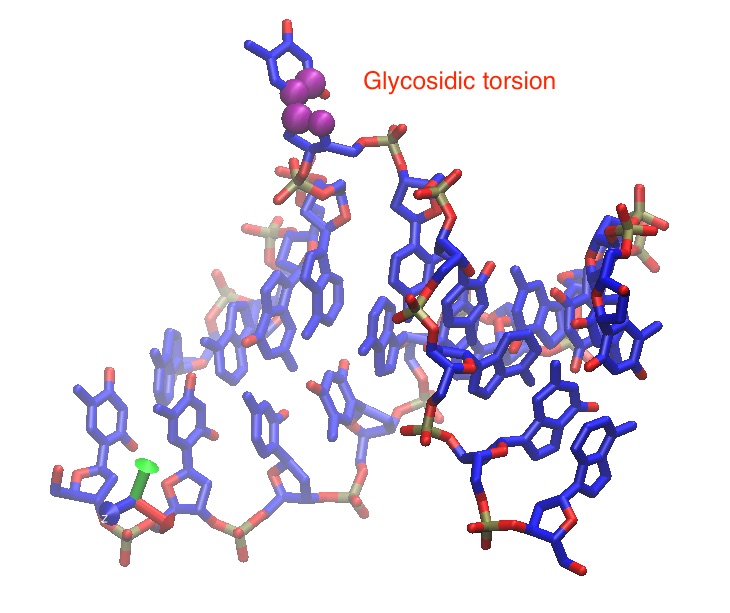
I defined two colvars: Pseudo-torsion and Glycosidic torsion to find path
for base flipping in DNA. My initial centers are the following:
Frame Pseudo #Frame Glycosidic
1 -22.9834 1 -130.0178
2 -1.8113 2 -105.8328
3 17.1431 3 -87.6128
4 18.1844 4 -59.2702
5 28.7286 5 -113.0601
6 37.1831 6 -123.4999
7 48.8440 7 -108.6611
8 60.1785 8 -151.3533
9 66.9365 9 -120.1098
10 68.9553 10 -137.1430
11 81.9498 11 -118.3375
12 122.5714 12 -154.9839
13 127.7331 13 -132.3430
14 145.1492 14 -146.8632
15 125.7844 15 -112.9243
16 144.7185 16 -134.7721
17 153.0255 17 -146.5084
18 167.3042 18 -127.8211
19 175.7482 19 -139.4776
20 179.6935 20 61.0230
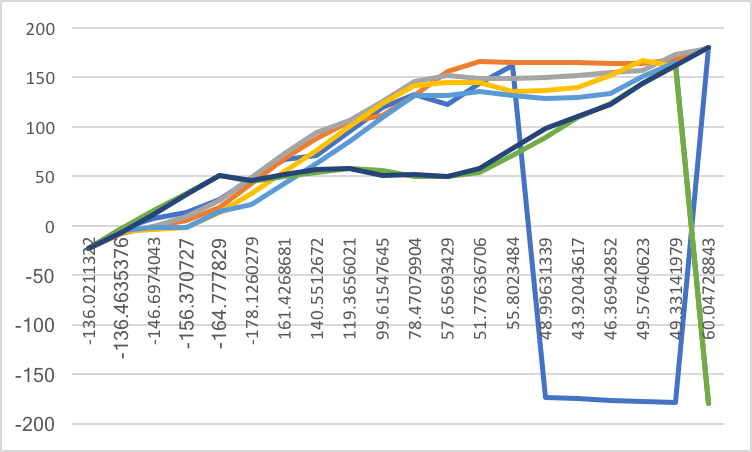
But after I simulate it using string methods, I have 20 images, 20 repeats
per image and 300 iterations per repeats. I found some values changed from
positive to negative, such as the first iterations below:
center of image 1 : 20 -0.40085575 -2.39713917
center of image 2 : 20 -0.04998067 -1.95821022
center of image 3 : 20 0.12711176 -1.43258465
center of image 4 : 20 0.22593965 -1.67138273
center of image 5 : 20 0.46420370 -2.12574684
center of image 6 : 20 0.82577461 -2.03805261
center of image 7 : 20 1.16971343 -2.49178907
center of image 8 : 20 1.24398057 -2.30938805
center of image 9 : 20 1.65712794 -2.21598440
center of image 10 : 20 2.08806127 -2.58816551
center of image 11 : 20 2.30771252 -2.34113196
center of image 12 : 20 2.14452605 -2.12182890
center of image 13 : 20 2.50822092 -2.44579490
center of image 14 : 20 2.82097066 -2.25111436
center of image 15 : 20 -3.03275023 -2.29560698
center of image 16 : 20 -3.05625542 -2.37193291
center of image 17 : 20 -3.07979668 -2.77849152
center of image 18 : 20 -3.10334797 1.34943046
center of image 19 : 20 -3.12688318 1.11151901
center of image 20 : 20 3.13280899 1.05163244
Please find attached two torsions I defined and final string plot.
Best,
*Chunli*
On Thu, Aug 17, 2017 at 6:48 PM, Feng Pan <fpan3.ncsu.edu> wrote:
> Hi, Chunli
>
> String method can only give the least free energy path in the phase space,
> cannot
> give the whole landscape of free energy.
>
> To get the PMF, you can use umbrella sampling, or the ABMD method by &abmd
> module,
> you can check the manual for details.
>
> Best
> Feng
>
> On Thu, Aug 17, 2017 at 1:42 AM, Chunli Yan <utchunliyan.gmail.com> wrote:
>
> > Hello,
> >
> > After I finished the simulation by using string methods, I got a lists of
> > output file for each image (mdcrd*, rst*, stsm* and so on). In amber
> > manual:
> >
> > When you get the biasing potential (*.nc file), you can always use the
> > nfe-umbrella-slice utility to access
> >
> > its content and get a friendly-written ASCII file from which one can
> obtain
> > the free energy map. The output
> >
> > is the free energy value, which is the opposite of the biasing potential
> (
> > f = U (units kcal*=*mol )). The
> >
> > nfe-umbrella-slice utility has been included in AmberTools.
> >
> >
> > Usage: nfe-umbrella-slice [options] bias_potential.nc
> >
> >
> > I am wondering how to compute free energy along the image. How to get the
> > biasing potential.
> >
> >
> > Thanks,
> >
> >
> > Best,
> >
> >
> > *Chunli*
> > _______________________________________________
> > AMBER mailing list
> > AMBER.ambermd.org
> > http://lists.ambermd.org/mailman/listinfo/amber
> >
>
>
>
> --
> Feng Pan
> Ph.D. Candidate
> North Carolina State University
> Department of Physics
> Email: fpan3.ncsu.edu
> _______________________________________________
> AMBER mailing list
> AMBER.ambermd.org
> http://lists.ambermd.org/mailman/listinfo/amber
>
_______________________________________________
AMBER mailing list
AMBER.ambermd.org
http://lists.ambermd.org/mailman/listinfo/amber

(image/jpeg attachment: Pseudo-torsion.jpg)

(image/jpeg attachment: Glycosidic-torsion.jpg)

(image/png attachment: string.png)
