Date: Fri, 9 Jun 2017 11:10:05 +0530
Dear Amber users,
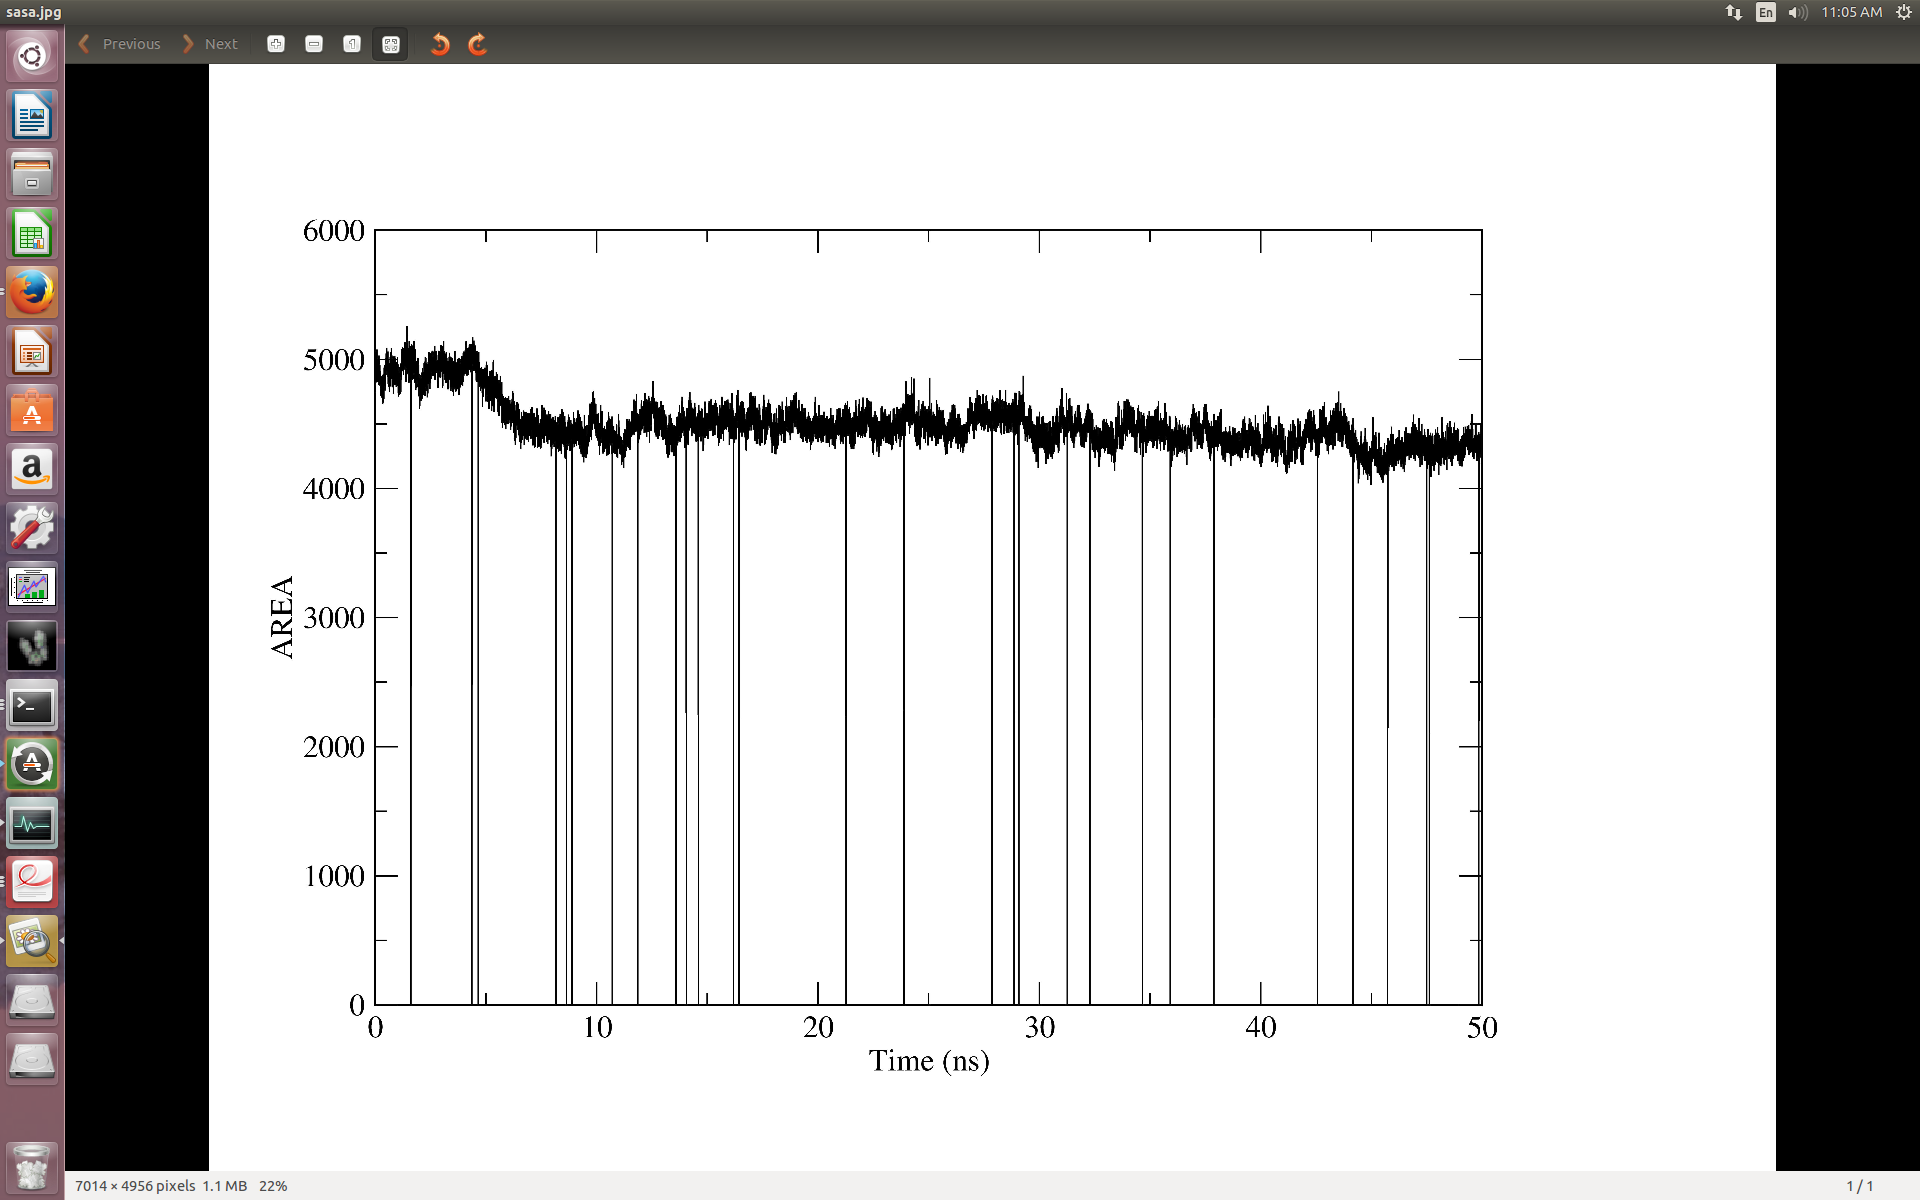
I am using cpptraj for trajectory analysis. when calculating
SASA found this type of plot.
I can't understand why vertical lines is present in plot? see the
plot how to solve this issue?
command use for calculation is
molsurf :1-81 out sasa.dat time 0.002 Probe
*Thank You and Best Wishes*
--
*Regards*
Garima Singh
AcSIR-PhD Fellow
Biotechnology Division
C/o Dr. Ashok Sharma (Chief Scientist and Head Biotechnology Division)
Central Institute Of Medicinal And Aromatic Plant
CSIR-CIMAP
Lucknow
garimabioinfo.gmail.com
*INDIA* Please don't print this e-mail unless you really need to. Be Green !
_______________________________________________
AMBER mailing list
AMBER.ambermd.org
http://lists.ambermd.org/mailman/listinfo/amber
(image/png attachment: Screenshot_from_2017-06-09_11:05:59.png)
