Date: Wed, 19 Oct 2016 07:54:45 +0000 (UTC)
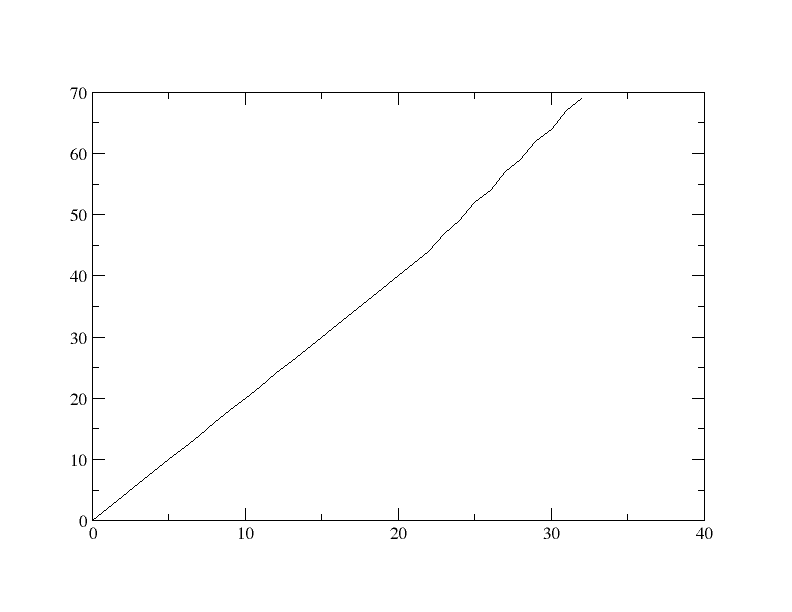
Dear All,I have run 70 ps heating step to equilibrate my system before moving on to running any production MD simulations. After that, I analyzed output of heating steps. I have followed this tutorial for plotting http://ambermd.org/tutorials/basic/tutorial3/section6.htm. The volume, density and pressure graph of my analysis is weird. I don’t understand the reason. I have attached images here.
Kindly help me in this regards. Best Regards, Saman Yousuf Ali
_______________________________________________
AMBER mailing list
AMBER.ambermd.org
http://lists.ambermd.org/mailman/listinfo/amber
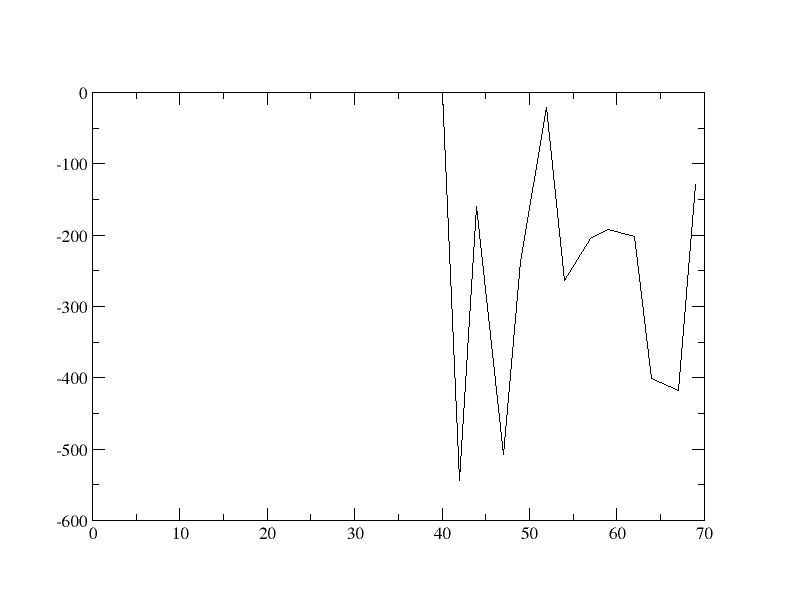
(image/png attachment: summaryPRES.png)

(image/png attachment: summary-Volume.png)
(image/png attachment: summary-Density.png)
