Date: Fri, 20 Sep 2013 15:56:34 +0900
Hi, Thomas
Thanks for your good comments,
However, I still have some question about how to use option "epsilon" and
"clusters".
Normally,* what case should we use "epsilon" or "clusters"?*
*when I publish my result, is it necessary to analysis all frames?*
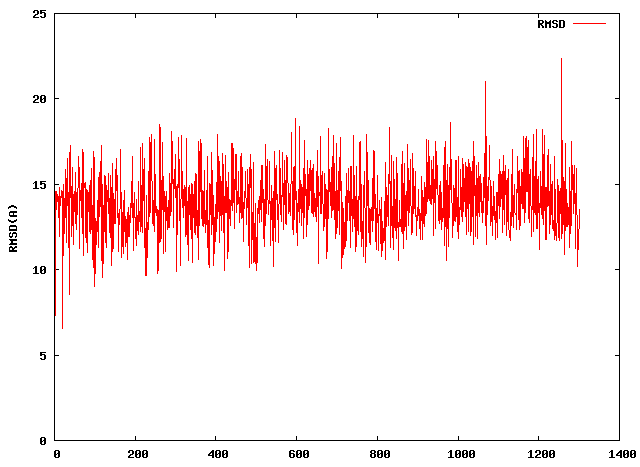
I created the 2D-rms plot as your advice.
> trajin mdcrd 1 32500 25
> rms2d out 2drms.gnu :2-103.CA
[image: Inline image 1]
This 2D-rms plot how can help us?
In my case, "* **A snapshot may*
*become a member of its closest cluster if the rmsd is smaller*
*than a given cutoff (3 Å)." *described at the paper,
*if I want to do the same analysis with the paper to give a cutoff value,*
*should I set the epsilon option at the following input file ?*
cluster out cutoff-3 all amber representative pdb average pdb \
averagelinkage epsilon 3.0 rms :2-103.CA sieve 25
Really, I did the clustering analysis used above input file, and compared
best 3 most
populated cluster's representative structure with the figure on the paper,
there are very different.
*Maybe my initial extend structure at REMD simulation is not same with
paper's structure. If the others parameter is same, is it possible to get
the same result with published paper?*
Thanks a lot .
Jacky
On Wed, Sep 18, 2013 at 1:50 AM, Thomas Cheatham <tec3.utah.edu> wrote:
>
> > trajin ../remd.340.8k.binpos
> > cluster out cluster all Amber representative pdb average pdb
> averagelinkage
> > epsilon 3.0 rms :2-103.CA
> ...
> > I finished the ptraj cluster analysis, use the above input file.
> > The whole process is used about 20 days.
>
> As is often mentioned on this list, it is wise to start with small /
> tractable problems first before jumping into a 20 day potential waste of
> time.
>
> First, it is advisable to understand how many potential clusters might be
> present and/or to start with a smaller trajectory. Normally you only
> initially want to look at ~1000-2000 frames in order to make the
> calculation tractable.
>
> I often will create a 2D-rms plot (with 2drms in ptraj or rms2d in
> cpptraj). For cpptraj, assuming I have a file with 1 million frames, I
> would load every 1000th,
>
> trajin mdcrd 1 999999 1000
> rms2d out 2drms.gnu :2-103.CA
>
> Then look at it with gnuplot.
>
> > ( *Why spend so long time ?*)
>
> You had lots of frames and it is a comparison of every frame to every
> frame so the complexity grows rapidly...
>
> > cluster.txt
>
> That file (cluster.txt) should have information on the cluster
> populations. There are also in the log file.
>
> I do not know why it is not able to write the files, but perhaps the disk
> was full? Note that in general likely you do not want 5476 clusters as
> they would be very difficult to look at / analyze (unless doing some kind
> of Markov state model). Rather than cluster by epsilon, initially, I
> would try to specify some reasonable set, something like 10 or 25
> clusters. I would also use the sieve option so that it would be much
> faster. With 32500 frames, I would do every 25th frame,
>
> cluster out cluster-10 all amber representative pdb average pdb \
> averagelinkage clusters 10 rms :2-103.CA sieve 25
>
> Note also that there are new and faster cluster commands in cpptraj...
>
> --tec3
>
>
>
> _______________________________________________
> AMBER mailing list
> AMBER.ambermd.org
> http://lists.ambermd.org/mailman/listinfo/amber
>
_______________________________________________
AMBER mailing list
AMBER.ambermd.org
http://lists.ambermd.org/mailman/listinfo/amber
(image/png attachment: 2drms.png)
