Date: Mon, 25 Feb 2013 13:33:06 +0800
Hi all,
I calculated the dihedral angles (D1, D2) for a molecule and plotted a D1
vs. D2 graph. But i would like to know the conformation population
distribution of the molecule.
My question is:
1. How can i retrieve the number of conformation or the population
information with D1 and D2 using ptraj?
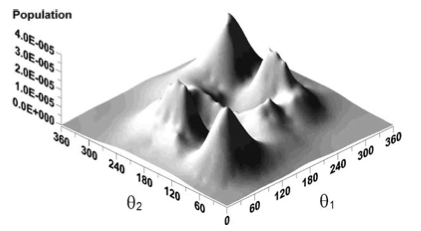
2. How can i then use the data to plot a 3D conformational
population distribution plot (see the image)?
[image: Inline image 2]
Thanks and regards,
Colvin
_______________________________________________
AMBER mailing list
AMBER.ambermd.org
http://lists.ambermd.org/mailman/listinfo/amber

(image/png attachment: D1D2.png)
