Date: Fri, 30 Nov 2012 19:46:52 +0530
Dear amber users,
I am simulating a trimeric protein a with flexible C-terminal region for 50
ns. Each chain is 210 aa in length. Residues 211 and 212 are two structural
Cl- ions.
I am having imaging issues while extracting the structures and performing
any analysis. I have extracted pdb structures with different image center
options.
Without any imaging, the chains are separated in different directions and
with different options, the location of these chains vary.
I went through the amber mailing list and with the its help, I finally
found the image commands shown below gave reasonably good structures when
visualized.
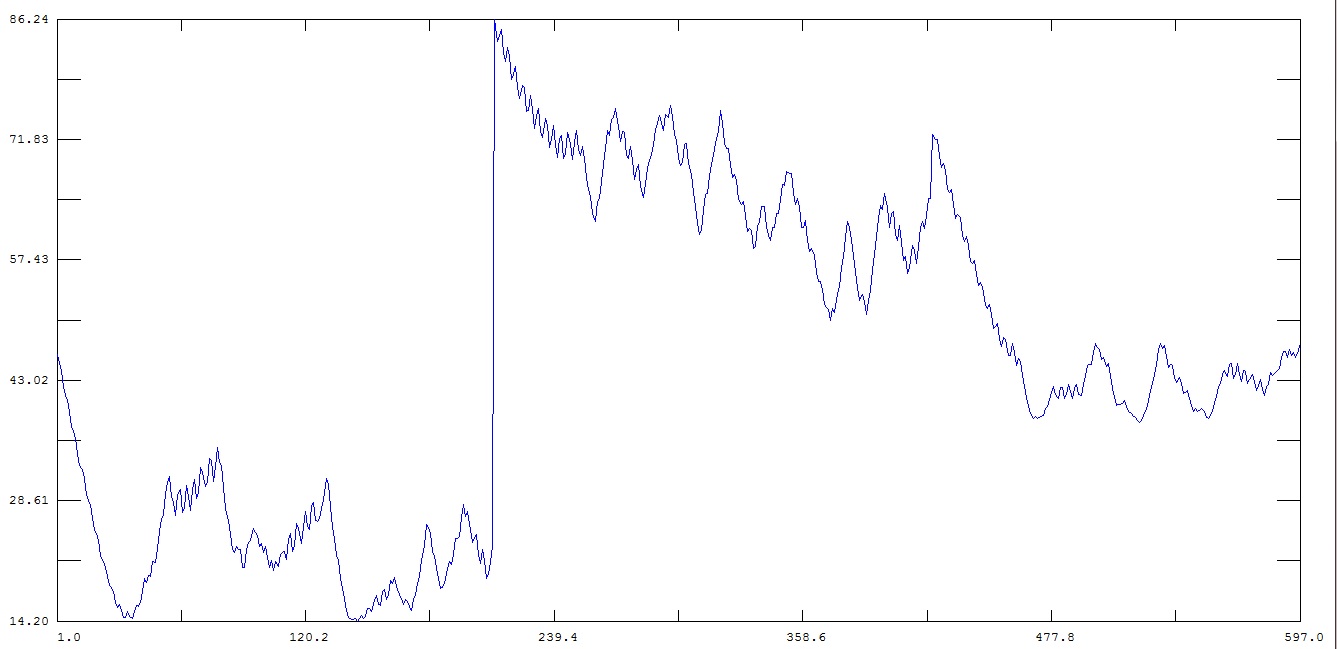
Whereas, when I use this for analyzing the RMS fluctuations very strange
behavior is seen.
The ptraj script that I use for generating RMS fluctuation is as follows:
trajin md1.mdcrd 1 500 1
-
-
-
trajin md50.mdcrd 1 500 1
strip :WAT,Cl-
center :1-210 mass
image :1-210 bymask :1-210
center :1-423 mass
image :1-423 bymask :1-423
center :1-632 mass
image :1-632 bymask :1-632
image origin center
atomicfluct out rmsf_md50ns.out .CA byatom
When I plot the output from this script (rmsf_with_imaging.jpg) there is a
sudden increase in fluctuation at the beginning of the second chain which
starts at 213.
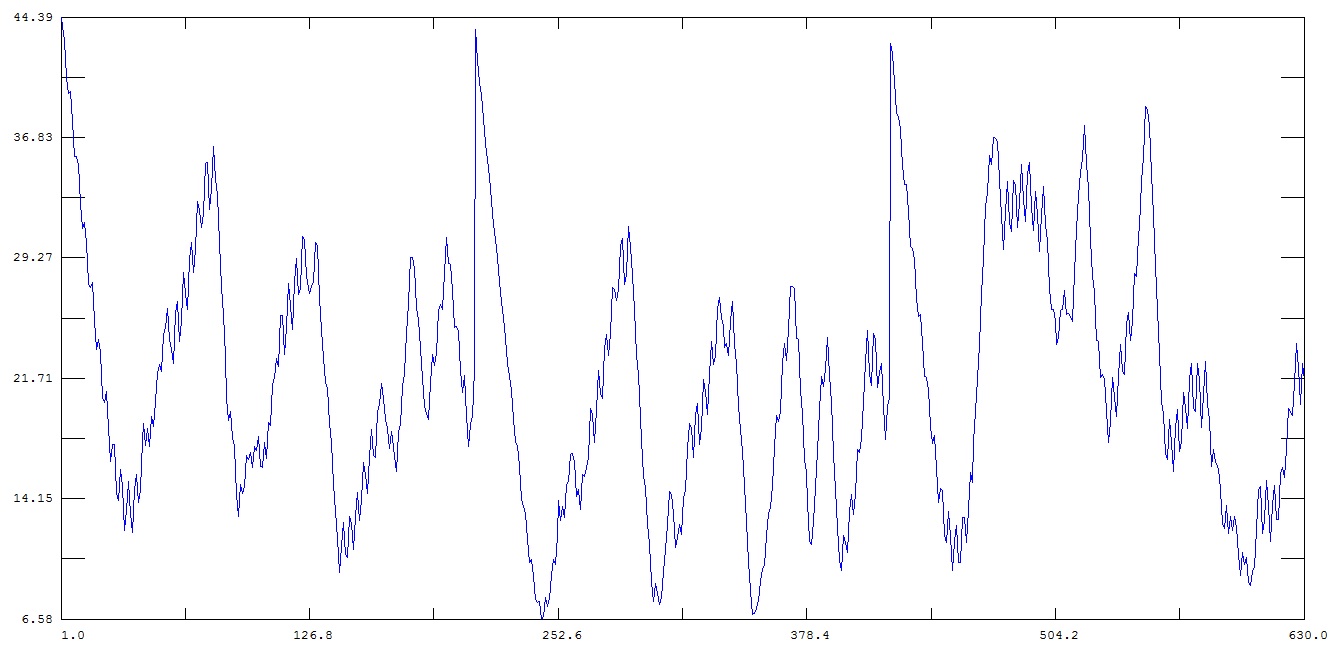
But when I don't use any imaging commands (rmsf_no_imaging.jpg), the rms
fluctuation does not show any such sudden increase.
I have attached the images of these plots.
Why is this this strange behavior observed?
How will I make sure which set of image center commands works better for my
system.
Any suggestions would be very helpful.
--
Thank you,
With regards,
B. Sangeetha
Ph.D Scholar,
Centre for Bioinformatics,
Pondicherry University,
Pondicherry,
India
_______________________________________________
AMBER mailing list
AMBER.ambermd.org
http://lists.ambermd.org/mailman/listinfo/amber

(image/jpeg attachment: rmsf_with_imaging.jpg)

(image/jpeg attachment: rmsf_no_imaging.jpg)
