Date: Fri, 6 Jul 2012 20:37:17 +0100
Dear Amber community,
I was doing some benchmarks on my system using the
GPU boards I have and the 16 cores CPU of my machine.
After minimising and equilibrating the system, I ran four 1ns simulation using:
- 16 cores of my CPU
- 1 Tesla C2070
- 2 Teslas C2070
- 1 GeForce GTX 470
Then, after centering (ptraj center) and re-imaging (ptraj image) and
aligning (ptraj rms)
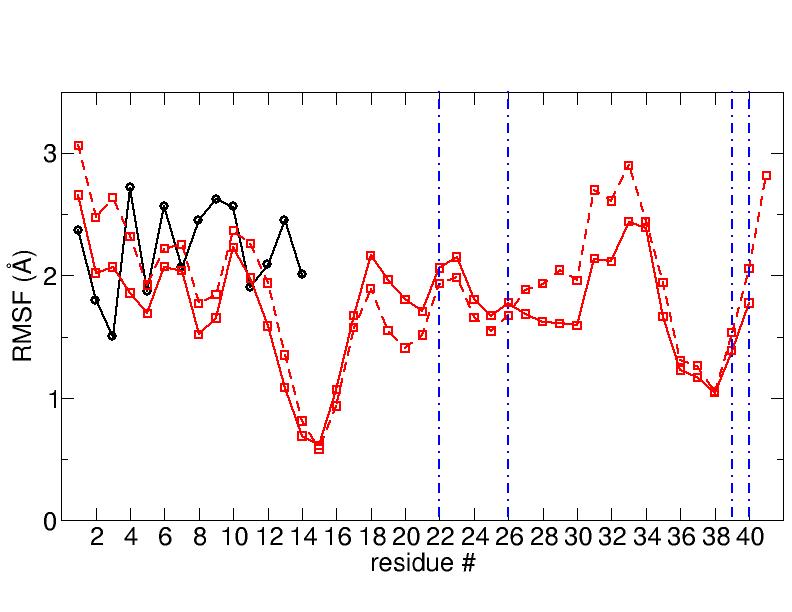
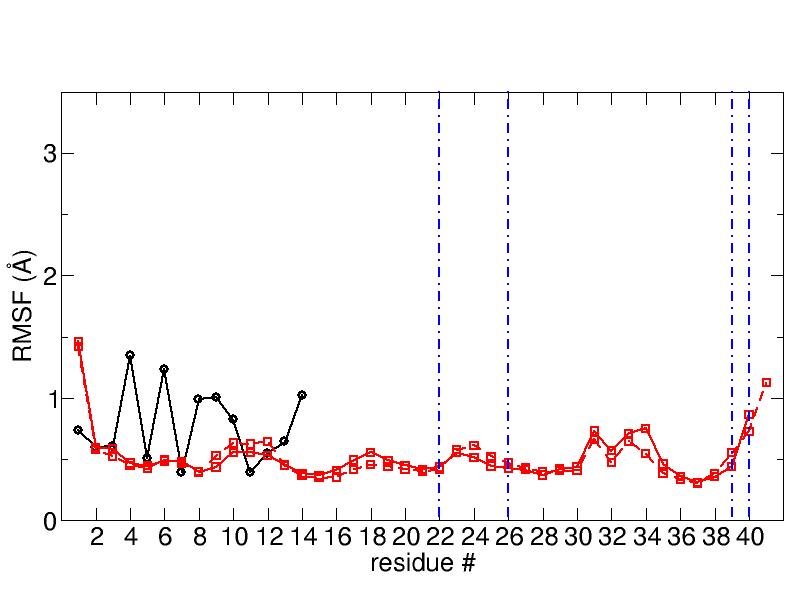
the produced trajectories I have worked out the RMSF and I obtained a
substantial
difference between the 16cores CPU trajectory and the GPU ones
(RMSFs obtained from the 3 different GPU runs are practically the same).
I enclose the graphs to show the results (solid black line is the
ligand, solid red line is
the first protein monomer and dashed red line is the second protein monomer and
the vertical blue lines are not important).
Any idea on which is the correct one?
Regards,
--
Dr Massimiliano Porrini
Institute for Condensed Matter and Complex Systems
School of Physics & Astronomy
The University of Edinburgh
James Clerk Maxwell Building
The King's Buildings
Mayfield Road
Edinburgh EH9 3JZ
Tel +44-(0)131-650-5229
E-mails : M.Porrini.ed.ac.uk
             mozz76.gmail.com
             maxp.iesl.forth.gr
_______________________________________________
AMBER mailing list
AMBER.ambermd.org
http://lists.ambermd.org/mailman/listinfo/amber
(image/jpeg attachment: rmsf_16cores.jpg)
(image/jpeg attachment: rmsf_GTX470.jpg)
