Date: Fri, 29 Jun 2012 14:32:16 +0200
hello guys:
here is my test for POPE based on the latest lipid 11 FF. I am
using the following ptraj.in for analysis:
trajin md.mdcrd 1 50000 10
vector POPE :314-679 box out pope.vector
here is the output file:
# FORMAT: frame vx vy vz cx cy cz cx+vx cy+vy cz+vz
# FORMAT where v? is vector, c? is center of mass...
1 63.9490 63.9490 91.6050 0.0000 0.0000 0.0000 63.9490
63.9490 91.6050
2 64.0190 64.0190 91.5460 0.0000 0.0000 0.0000 64.0190
64.0190 91.5460
3 64.1090 64.1090 91.2790 0.0000 0.0000 0.0000 64.1090
64.1090 91.2790
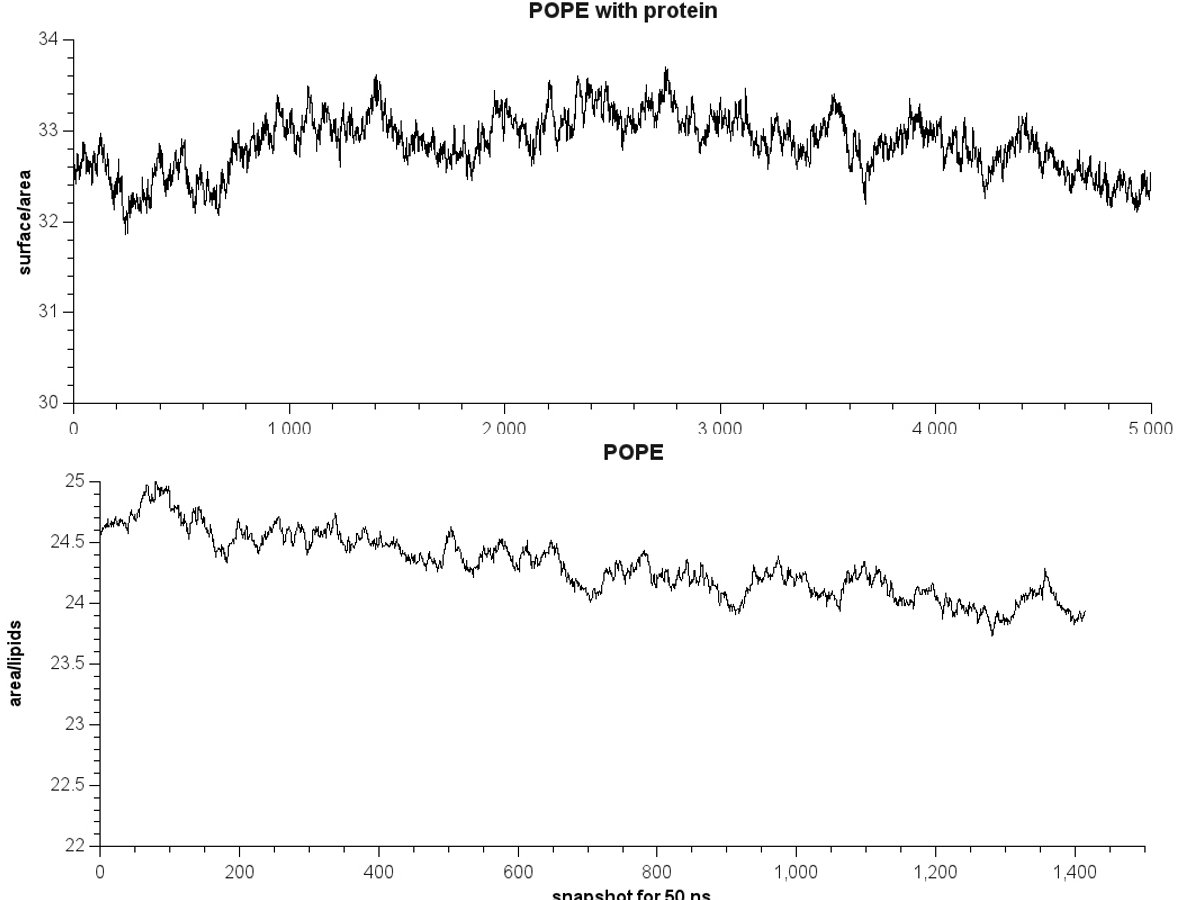
I use X multiple Y and divide my lipids number (126 total in all). I've
run two MD, one is 50 ns for POPE itself; the second is protein in
pre-equilibrated POPE (CHARMM 36 FF 50 ns). here is md.in for production:
production dynamics
&cntrl
imin=0, irest=1, ntx=5,
nstlim=50000000, dt=0.002,
ntc=2, ntf=2,
cut=10.0, ntb=2, ntp=3, taup=2.0,
ntpr=1000, ntwx=1000, ntwr=50000,
ntt=1,
iwrap=1,
temp0=310.0,
csurften=3, ninterface=2,gamma_ten=26,
/
enclosed this email, you can find a plot for both cases. It seems that
the area/lipids is far from the plot Ross provides. Does anybody have
any idea what's going on?
thank you very much
Best
Albert
_______________________________________________
AMBER mailing list
AMBER.ambermd.org
http://lists.ambermd.org/mailman/listinfo/amber
(image/jpeg attachment: pope_plot.jpg)
