Date: Wed, 16 Feb 2011 09:13:57 +0800
Thank you all.
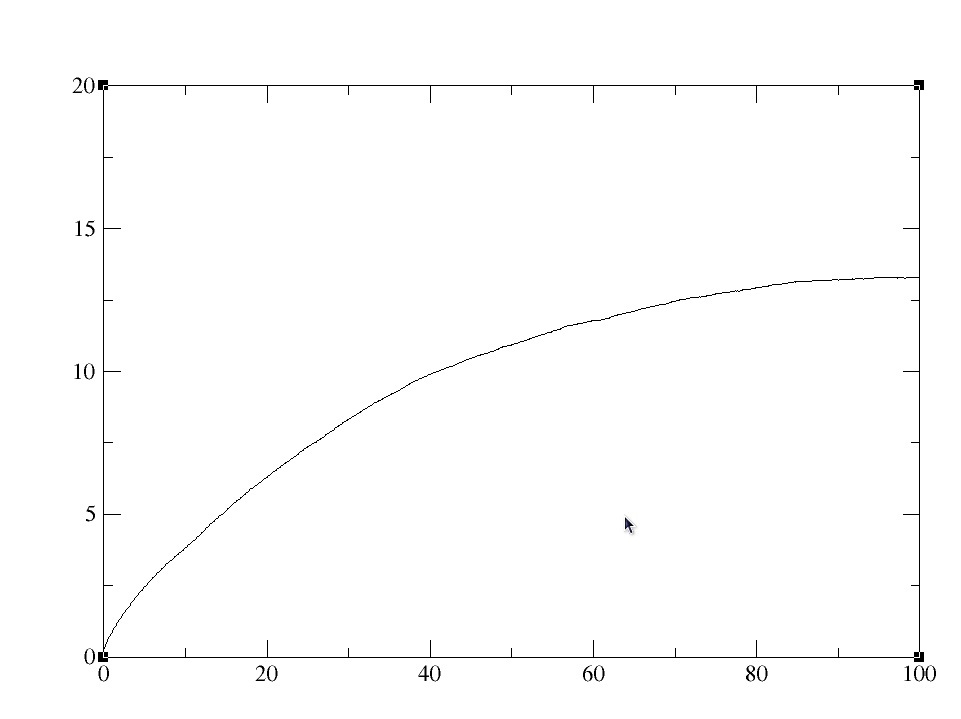
Here is the rms plot for the first 100ps.
trajin 100ps.mdcrd
rms first mass out time 0.1 :1-200
center :1-200
image
strip :WAT
strip :Na+
On Wed, Feb 16, 2011 at 2:49 AM, Bill Ross <ross.cgl.ucsf.edu> wrote:
> > I've run 2ns simulation and plotted the potential energy and volume from
> > the output file. They looked stable, however when I did the rmsd
> analysis
> > on the system referring to the first frame of the trajectory, the rmsd
> > values increasing from 0.2 A up to more than 100 A.
>
> You didn't send your RMS plot, so we can't see how abruptly it jumps.
>
> If you are including waters in your measurement, this could
> easily explain it, since waters are mobile.
>
> You should always fit the solute coordinates to a common set before
> getting RMS, otherwise drift and rotation will lead to an
> increase. Also, if one of a set of molecules has been translated across
> the box due to iwrap=1, you will need to use ptraj's image cmd to avoid
> and RMS jump from that.
>
> Bill
>
> _______________________________________________
> AMBER mailing list
> AMBER.ambermd.org
> http://lists.ambermd.org/mailman/listinfo/amber
>
_______________________________________________
AMBER mailing list
AMBER.ambermd.org
http://lists.ambermd.org/mailman/listinfo/amber

(image/jpeg attachment: 100ps.jpg)
