Date: Fri, 20 Nov 2009 11:32:24 -0500
Hi,
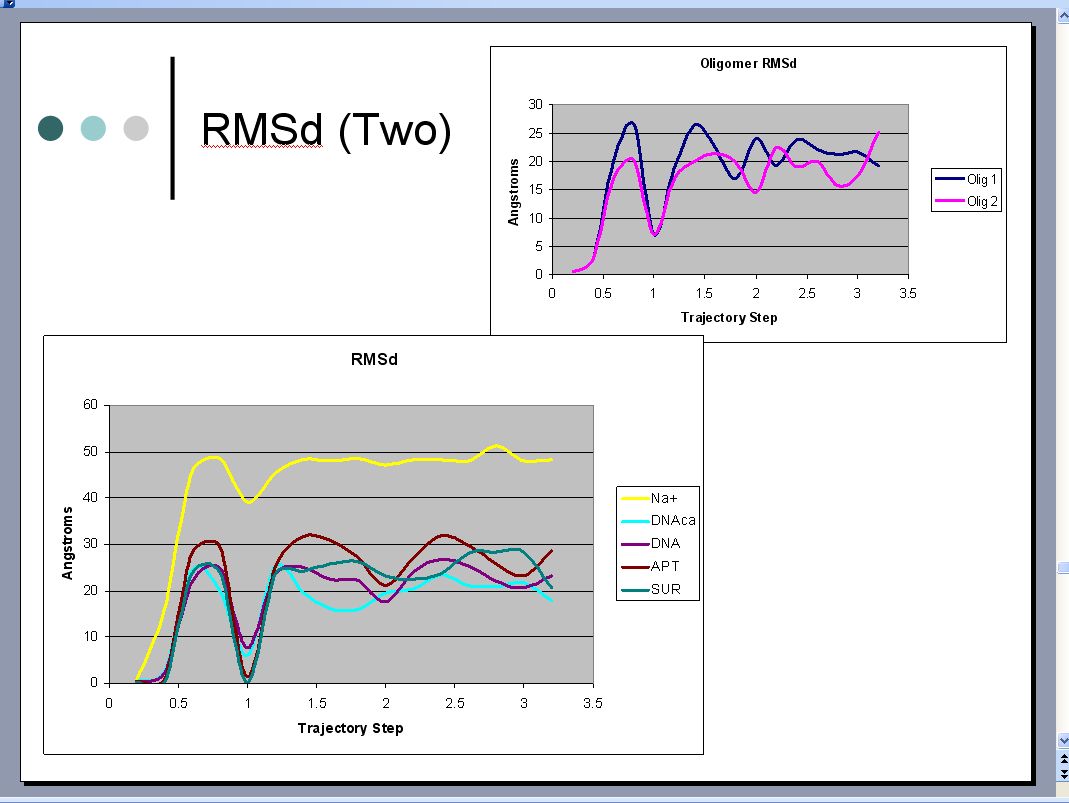
I need help understanding an RMSd plot.
after a dynamics run i use the following ptraj scripts
strip
{trajin MD.mdcrd
trajout MDnw.mdcrd
center:1-126
image familiar
strip :WAT*
go
}
and
rms
{trajin MDnw.mdcrd
trajin MD1nw.mdcrd
reference 1.rst
rms reference mass out lin.dat ':1' time 0.2
rms reference mass out SUR.dat ':2' time 0.2
rms reference mass out APT.dat ':3' time 0.2
rms reference mass out DNA.dat ':4-22' time 0.2
rms reference out DNAa.dat ':4-22.%CA' time 0.2
rms reference mass out olig1.dat ':23-74' time 0.2
rms reference mass out olig2.dat ':75-126' time 0.2
rms reference out Naion.dat ':231-249' time 0.2
}
the dynamics run is as follows
Molecular Dynamics for 2ns - only Surface atoms are fixed
&cntrl
imin = 0,
irest = 1,
ntx = 5,
ntb = 2,
pres0 = 1.0,
ntp = 2,
taup = 5.0,
cut = 8.0,
ntr = 1,
ntc = 2,
ntf = 2,
temp0 = 300.0,
ntt = 1,
iwrap = 1,
nstlim = 1000000, dt = 0.002
ntpr = 5000, ntwx = 5000, ntwr = 50000
/
Hold Surface fixed
20.0
RES 2 2
END
END
shouldn't the plot increase in the beginning and then level off, i don't
understand why would RMSd oscillate like this. i hope i made an error
with my calculations and this is not an indication of a problem with the
simulation.
Many thanks,
Taufik
_______________________________________________
AMBER mailing list
AMBER.ambermd.org
http://lists.ambermd.org/mailman/listinfo/amber
(image/jpeg attachment: rmsd.jpg)
